Science
Breathtaking Early Stages of Star Formation Captured With James Webb Space Telescope – SciTechDaily
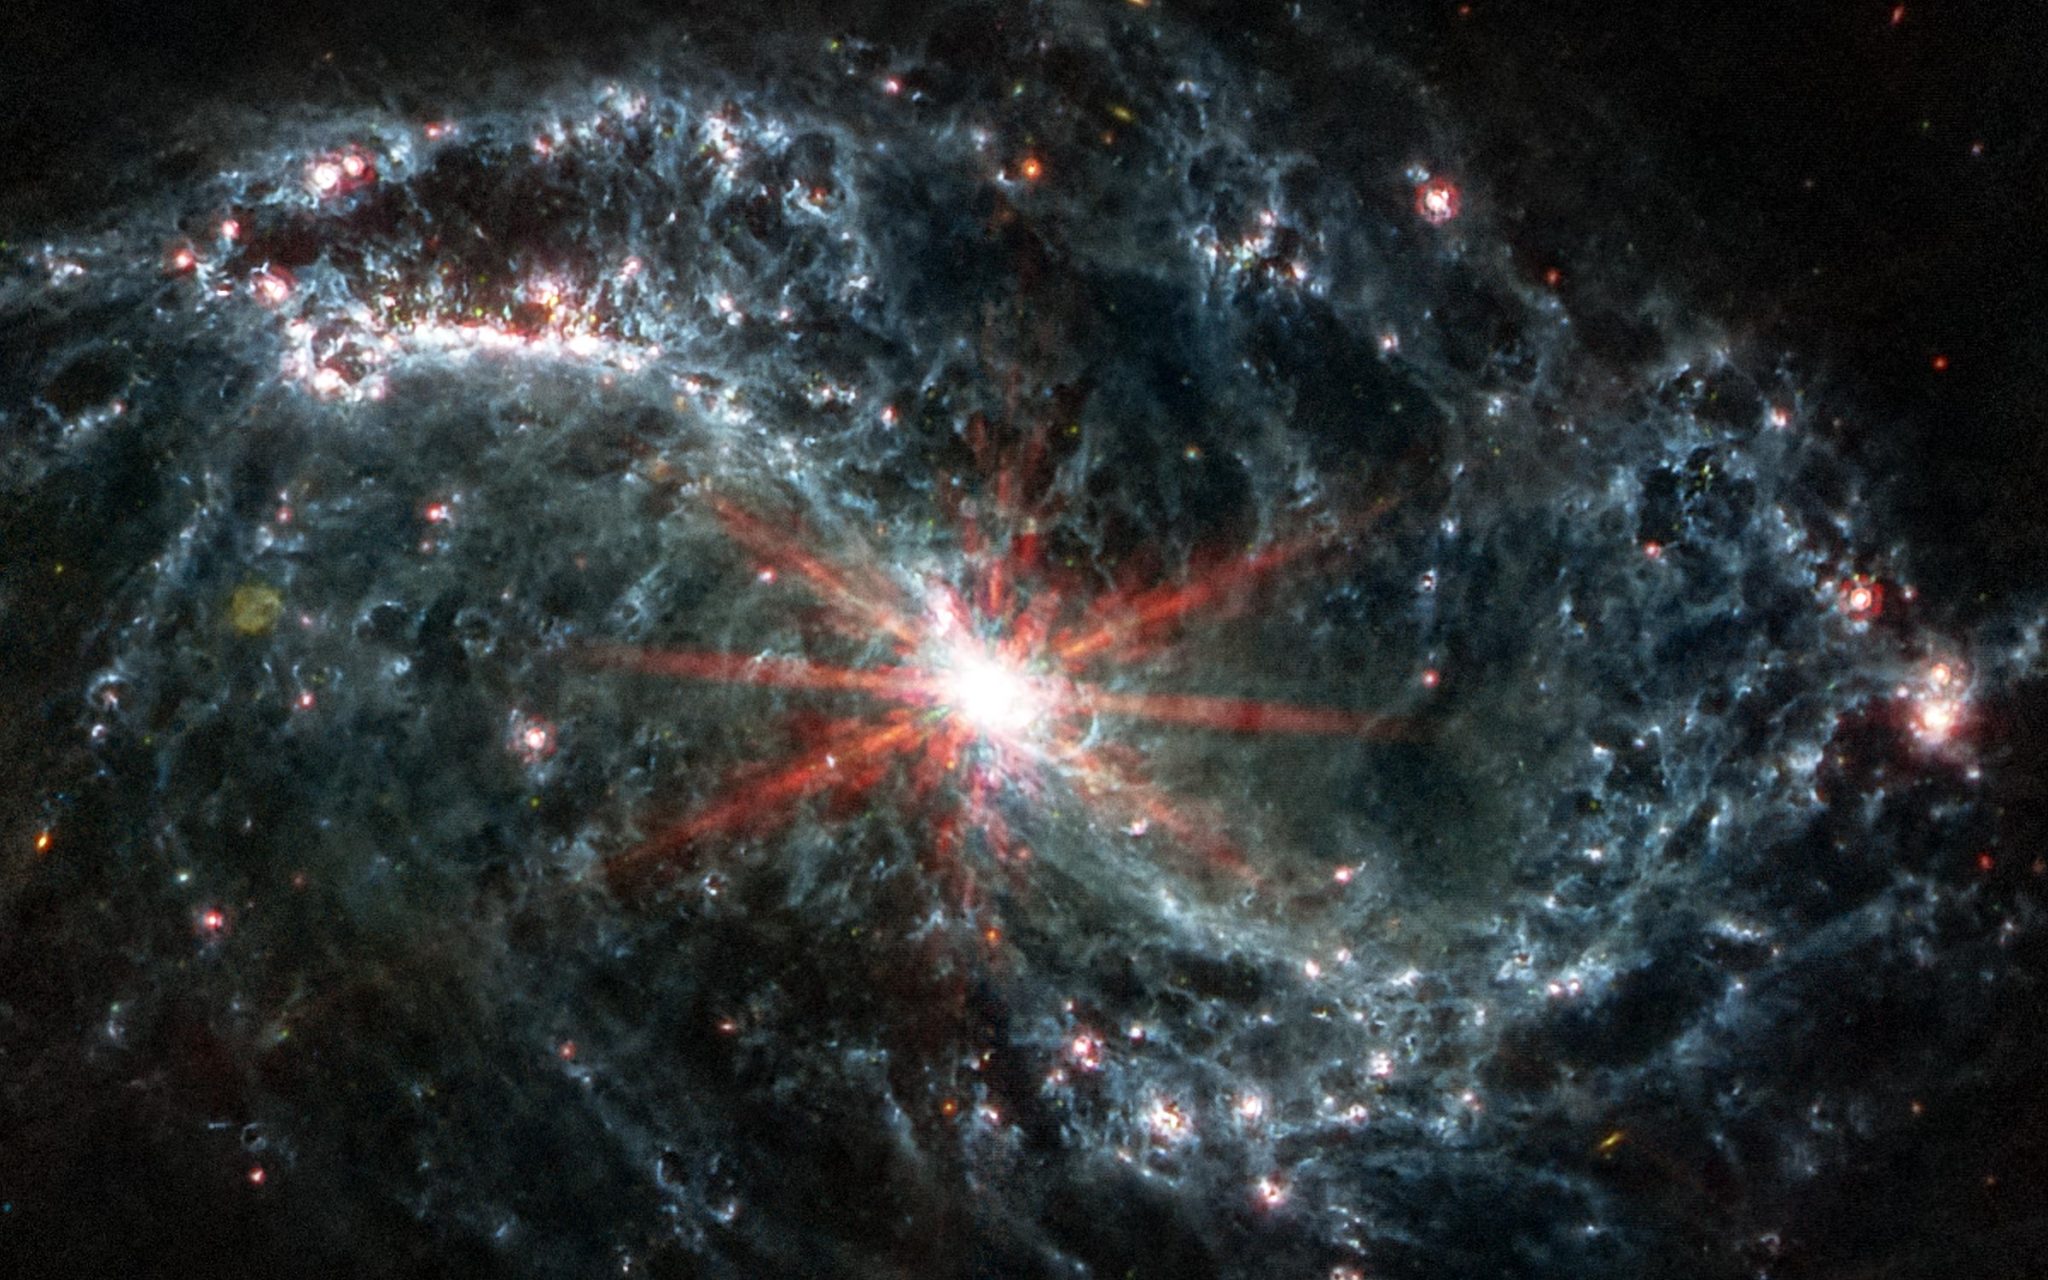
Researchers are getting their first glimpses inside distant spiral galaxies to see how stars formed and how they change over time, thanks to the James Webb Space Telescope’s ability to pierce the veil of dust and gas cloud. Credit: Science: NASA, ESA, CSA, Janice Lee (NOIRLab), Image Processing: Joseph DePasquale (STScI)
Webb space telescope’s mid-infrared capabilities allowed scientists to see past gas and dust clouds to observe previously obscured details in faraway galaxies.
A team of researchers has been able to see inside faraway spiral galaxies for the first time to study how they formed and how they change over time, thanks to the powerful capabilities of the James Webb Space Telescope.
“We’re studying 19 of our closest analogs to our own galaxy. In our own galaxy we can’t make a lot of these discoveries because we’re stuck inside it,” says Erik Rosolowsky, professor in the University of Alberta Department of Physics and co-author on a recent paper — published in The <span class="glossaryLink" aria-describedby="tt" data-cmtooltip="
” data-gt-translate-attributes=”["attribute":"data-cmtooltip", "format":"html"]”>Astrophysical Journal Letters — analyzing data from the James Webb telescope.
Unlike previous observation tools, the telescope’s mid-infrared instrument can penetrate dust and gas clouds to provide critical information about how stars are forming in these galaxies, and consequently, how they are evolving.
“This is light that is longer wavelength and represents cooler objects than the light we see with our eyes,” says Rosolowsky.
“The infrared light is really key to tracing the cold and distant universe.”
James Webb Space Telescope artist concept. Credit: NASA
So far, the telescope has captured data from 15 of the 19 galaxies. Rosolowsky and Hamid Hassani, a PhD student and lead author on the paper, examined the infrared light emitted from dust grains at different wavelengths to help categorize what they were seeing, such as whether an image showcased regular stars, massive star-forming complexes or background galaxies.
“At 21 micrometers [the infrared wavelength used for the images collected], if you look at a galaxy you will see all of those dust grains heated with light from the stars,” explains Hassani.
From the collected images, they were able to determine the age of the stars. They discovered they were observing young stars which “erupt[ed] onto the scene practically instantaneously, far faster than a lot of models had predicted,” says Rosolowsky.
“The age of these [stellar] populations is very young. They’re really just starting to produce new stars and they are really active in the formation of stars,” says Hassani.
Webb has two sides, divided by its sunshield: a hot side facing the Sun and Earth, and a cold side facing out into space, away from the Sun and Earth. The solar panels, communications antenna, navigation system, and electronic systems reside on the hot side facing the Sun and Earth. The mirrors and scientific instruments, which are very sensitive to infrared radiation, are housed on the cold side, where they are protected by the sunshield. Credit: STScI
The researchers also found a close relationship between the mass of stars in a region and how bright they were. “It turns out this was a brilliant way to find high-mass stars,” says Rosolowsky.
Rosolowsky terms high-mass stars “rock stars” because “they live fast, they die young and they really shape the galaxy around them.” When they’re forming, he explains, they release huge amounts of solar wind and gas bubbles, which halts star formation in that particular area while simultaneously stirring up the galaxy and sparking star formation in other areas.
“We’ve discovered this is actually really key for the long-term life of a galaxy, this kind of bubbling froth, because it keeps the galaxy from going through its fuel too quickly,” says Rosolowsky.
It’s a complex process, with each new star formation playing a larger role in how the galaxy changes over time, adds Hassani.
“If you have a star forming, that galaxy is still active. You have a lot of dust and gas and all of these emissions from the galaxy that trigger the next generation of the next massive star forming and just keep the galaxy alive.”
The more images scientists have that document these processes, the better they are able to infer what is going on in distant galaxies that have similarities to our own. Rather than looking at just one galaxy in depth, Rosolowsky and Hassani want to create what Rosolowsky calls a “galaxy atlas” of sorts by capturing images using as many methods as possible.
“Through the collection of all this data, in creating this great atlas, we’d be able to sort out what’s special about one galaxy versus the unifying themes that shape galaxies as a whole,” says Rosolowsky.
Reference: “PHANGS–JWST First Results: The 21 µm Compact Source Population” by Hamid Hassani, Erik Rosolowsky, Adam K. Leroy, Médéric Boquien, Janice C. Lee, Ashley T. Barnes, Francesco Belfiore, F. Bigiel, Yixian Cao, Mélanie Chevance, Daniel A. Dale, Oleg V. Egorov, Eric Emsellem, Christopher M. Faesi, Kathryn Grasha, Jaeyeon Kim, Ralf S. Klessen, Kathryn Kreckel, J. M. Diederik Kruijssen, Kirsten L. Larson, Sharon E. Meidt, Karin M. Sandstrom, Eva Schinnerer, David A. Thilker, Elizabeth J. Watkins, Bradley C. Whitmore and Thomas G. Williams, 16 February 2023, The Astrophysical Journal Letters.
DOI: 10.3847/2041-8213/aca8ab
Their paper was one of 21 research papers on the initial findings from the Physics at High Angular resolution in Nearby Galaxies (PHANGS) collaboration, published in a special focus issue of The Astrophysical Journal Letters.
Science
Scientists Identify Intense Heatwaves At The Bottom Of Ocean


|
Underwater heatwave can have significant impacts on marine life. (Representational Pic)
Global warming is causing temperature across the globe to rise. The rate has increased in the last decades, with climatologists warning of the extreme effects that the mankind has to experience. The scientists have also been tracking temperature data streaming in from ocean surfaces. But in a shocking discovery, they have found that marine heatwaves can unfold deep underwater too, even if there is no detectable warming signal above. The discovery is based on new modelling led by researchers at the US National Oceanic and Atmospheric Administration (NOAA).
The research detailing the underwater heatwave has been published in Nature Communications.
“This is the first time we’ve been able to really dive deeper and assess how these extreme events unfold along shallow seafloors,” the study’s lead author Dillon Amaya, a climate scientist with NOAA’s Physical Science Laboratory, is quoted as saying by Science Direct.
It is based on the analysis of underwater temperature of continental shelf waters surrounding North America.
“This research is particularly significant as the oceans continue to warm, not only at the surface but also at depth, impacting marine habitat along continental shelves,” said co-author Clara Deser.
The scientists found that marine heatwaves can be more intense and last longer than hot spells at the ocean surface, though it varies from coast to coast.
The simulations found that bottom marine heatwave and surface marine heatwave tend to occur at the same time in shallow regions where surface and bottom waters mingle. But in deeper parts of the oceans, bottom marine heatwaves can develop without any indication of warming at the surface.
Temperature spikes along the seafloor ranged from half a degree Celsius up to 5 degrees Celsius, the research further found.
According to NOAA, marine heatwaves are periods of persistent anomalously warm ocean temperatures, which can have significant impacts on marine life as well as coastal communities and economies.
According to data, about 90 per cent of the excess heat from global warming has been absorbed by the ocean, which has warmed by about 1.5 degrees Celsius over the past century.


Science
Watch the Chelyabinsk Meteor Breakup in this Detailed Simulation
|
The people of Chelyabinsk in Russia got the surprise of their lives on the morning of February 15, 2013. That’s when a small asteroid exploded overhead. The resulting shockwave damaged buildings, injured people, and sent a sonic boom thundering across the region.
The Chelyabinsk impactor was about 20 meters across. It broke up in the atmosphere in an airburst and sent a shower of debris across the landscape. The event awakened people to the dangers of incoming space debris. Since we experience frequent warnings about near-Earth objects, scientists want to understand what a piece of space rock can do.
These days, there are many observation programs across the planet. For example, NASA operates its Sentry System and ESA sponsors the NEODyS project. They and others track incoming space rock. The observation data help predict the impacts of all but the very smallest asteroid chunks that come our way. Despite those programs, it’s inevitable that something like the Chelyabinsk asteroid chunk will slip through. So, it’s important to understand what happens during such an impact.
Modeling the Chelyabinsk Meteor
Scientists around the world began studying the event almost as soon as it happened. They collected bits of the debris and studied images of the entire event. Researchers with the Planetary Defense program at the Lawrence Livermore National Laboratory recently released a highly detailed 3D animation of a simulated chunk of space rock modeled after the Chelyabinsk impactor. They based the materials of the object in their animation on meteorites recovered from the ground.
Because people recorded the event with cell phones and security cameras, the team compared their model to what everybody witnessed. It turned out to be very close to what actually happened.
“This is something that can really only be captured with 3D simulation,” said Jason Pearl, lead researcher on the project. “When you combine LLNL’s specialized expertise in impact physics and hydrocodes with the Lab’s state-of-the-art High Performance Computing capabilities, we were uniquely positioned to model and simulate the meteor in full 3D. Our research underlines the importance of using these types of high-fidelity models to understand asteroid airburst events. A lot of smaller asteroids are rubble piles or loosely bound collections of space gravel, so the possibility of a monolith is really interesting.”
So, How Did the Chelyabinsk Object Shatter?
The most often-asked question about the rock that smacked into Earth over Russia was: was it a single chunk of debris? Or was it a flying rubble pile? If it was a monolithic chunk of rock, that would imply specific details about the strength of the rock and how it broke up. If it was a flying rubble pile, it might have broken up earlier and higher in the atmosphere. The LLNL experiment implies strongly that the impact was a single monolithic rock. It broke up under the heat and pressure of atmospheric entry.
To model the impactor and its behavior, the research team used a computational method called “smoothed particle hydrodynamics (SPH).” It models an object in a fluidic flow. In this case, it treats the atmosphere as a fluid. The model also simulates what happens as a Chelyabinsk-sized hunk of rock moves through the simulated air.
In their simulation, the team found that the incoming object started to break up from the rear and the cracks moved from back to front. The timescale of crack propagation toward the front of the asteroid controls the time at which the asteroid splits into smaller fragments while entering Earth’s atmosphere. A collection of fragments lies near the shock front and that shields the rest of the fragmenting rock. Finally, when the impactor reaches about 30 kilometers above Earth’s surface, intact fragments separate. That’s when the debris is exposed to the free stream. Eventually, the debris cloud decelerates very quickly and the remaining fragments continue to break up as they fly through the air toward the ground.
The Physics of the Breakup
The disintegration of the Chelyabinsk object provided scientists with a “physics-rich” event to study. According to LLNL physicist Mike Owen, the coupling of the asteroid to the atmosphere depends on how much surface area it has. The greater the surface area, the more exposure it has to heat, stress and pressure. Those all combine to break it up.
“As the asteroid enters the atmosphere, you start to have sort of a catastrophic failure,” Owen said. “And it tends to compress in the direction of travel. It was like the asteroid was being squeezed in the direction of travel, breaking into distinct pieces that started to separate and break perpendicular to the direction of travel. All of a sudden, you’ve got a lot more material being exposed to the hypersonic interaction with the air, a lot more heat being dumped in, a lot more stress on it, which makes it break faster and you get sort of a cascading runaway process.”
Using Chelyabinsk To Understand Future Impacts
Models of impactors like this one provide insight into future events when chunks of space rock will hit Earth. One long-term goal would be to use such models to assess what will happen to a target region during an impact. Meteoric impacts are natural disasters that affect our planet just as fires and floods do. As such, there’s a need to predict and understand them so that people can be more prepared.
Researcher Cody Raskin points to our increased ability to detect such incoming impactors. “If we can see a small asteroid approaching Earth in time, we could run our model and inform authorities of the potential risk, similar to a hurricane map,” said Raskin. “They could then take appropriate protective actions, such as evacuating residents or issuing shelter-in-place orders, ultimately saving lives.”


Science
Stephen Hawking thought his thesis in ‘a brief history of time’ was wrong


|
In 2002, Thomas Hertog was urgently summoned to the office of his esteemed mentor, Stephen Hawking. With a sense of excitement radiating from his eyes, the renowned cosmologist communicated to Hertog through his computer-controlled voice system, declaring that he had experienced a change of heart. “My book, A Brief History of Time, is written from the wrong perspective,” Hawking announced. This statement consigned the popular scientific tome, which had sold over 10 million copies worldwide, to the waste bin. According to a report from the Guardia, Hertog, and Hawking then embarked on a new project, aiming to encapsulate their latest ideas about the universe in a fresh way.
Five years following the passing of Stephen Hawking, his final theory, titled On the Origin of Time, is set to be published in the UK next month. At a Cambridge festival lecture on March 31st, cosmologist Thomas Hertog, currently affiliated with KU Leuven University in Belgium, will discuss the origins and themes of the book. According to Hertog, Hawking struggled to comprehend how the universe was able to create conditions that are so perfectly suitable for life. These conditions include a precise balance of particle forces that enable the existence of chemistry and complex molecules, as well as the presence of only three dimensions of space that allow for the formation of stable solar systems and habitats for living organisms. Some cosmologists assert that without these specific characteristics, life as we know it may not have come to fruition in the universe.
A quick glance at Hawking’s life
Stephen Hawking was born on January 8, 1942, in Oxford, England. His father was a medical researcher, and his mother was a secretary. From an early age, Hawking was interested in science, especially physics and astronomy. He attended University College, Oxford, where he studied physics and graduated with honors in 1962. He then went on to pursue graduate studies in cosmology at Trinity College, Cambridge.
It was during his time at Cambridge that Hawking was diagnosed with a rare form of motor neuron disease that left him wheelchair-bound and unable to speak without the use of a computerized voice synthesizer. Despite this debilitating condition, Hawking continued his studies and research, becoming one of the most brilliant and influential scientists of his generation.
In 1974, Hawking proposed the theory of Hawking radiation, which suggested that black holes could emit radiation and eventually evaporate over time. This groundbreaking work established Hawking as a leading figure in theoretical physics, and he continued to make significant contributions to the field throughout his career. He also wrote several popular science books, including the best-selling A Brief History of Time, which helped make complex scientific ideas accessible to a wider audience.
Hawking received numerous awards and honors for his contributions to science, including the Albert Einstein Medal, the Presidential Medal of Freedom, and the Copley Medal, the highest honor of the Royal Society. He also served as the Lucasian Professor of Mathematics at Cambridge, a position once held by Isaac Newton.
Hawking passed away on March 14, 2018, at the age of 76, leaving behind a legacy of scientific achievement and popularizing science for the general public. His work has inspired countless people around the world to pursue careers in science and to explore the mysteries of the universe.


-
News12 hours ago
Inflation, National and Private Debt, Possible Economic Collapse
-
Tech12 hours ago
Welcome to the Luddite Revolution
-
Real eState15 hours ago
In Europe, Home Sales to Americans Are on the Rise
-
Business16 hours ago
Fed, other central banks set joint liquidity operation
-
Tech16 hours ago
Final Fantasy 16 will take you about 35 hours to beat, 70-80 hours to complete
-
Health13 hours ago
Japanese Bento Spot On Robson Street Closes After 10 Years Of Operation
-
Real eState12 hours ago
Real estate investor pleads guilty to fraud on $149M loan
-
Business11 hours ago
Canada among central banks banding together to calm markets after UBS deal to buy Credit Suisse