Despite media headlines, podcasts, and broadcasts suggesting “doom and gloom” lurks around the corner, investor bullishness has increased markedly sincethe October lows. This isn’t the first time we have discussed investor sentiment, which is often wrong at the extremes.
“One of the hardest things to do is go “against” the prevailing bias regarding investing. Such is known as contrarian investing. One of the most famous contrarian investors is Howard Marks, who once stated:
‘Resisting – and thereby achieving success as a contrarian – isn’t easy. Things combine to make it difficult; including natural herd tendencies and the pain imposed by being out of step, particularly when momentum invariably makes pro-cyclical actions look correct for a while.
Given the uncertain nature of the future, and thus the difficulty of being confident your position is the right one – especially as price moves against you – it’s challenging to be a lonely contrarian.‘” – Sentiment Is So Bearish It’s Bullish
That bolded sentence is the most relevant to today’s discussion.
Extreme sentiment readings, either bullish or bearish, typically denote the point where investors make the most mistakes. Such is because the emotions of “fear” or “greed” are driving investment decisions. From a contrarian investing view, we should be “buyers” when everyone is selling or “sellers” when everyone is buying.
However, that is a difficult thing to do because, as individuals, our own emotions are driving us to “follow the herd.” As Howard Marks notes, it is “challenging and lonely” to be a contrarian. However, it is often the correct thing to do.
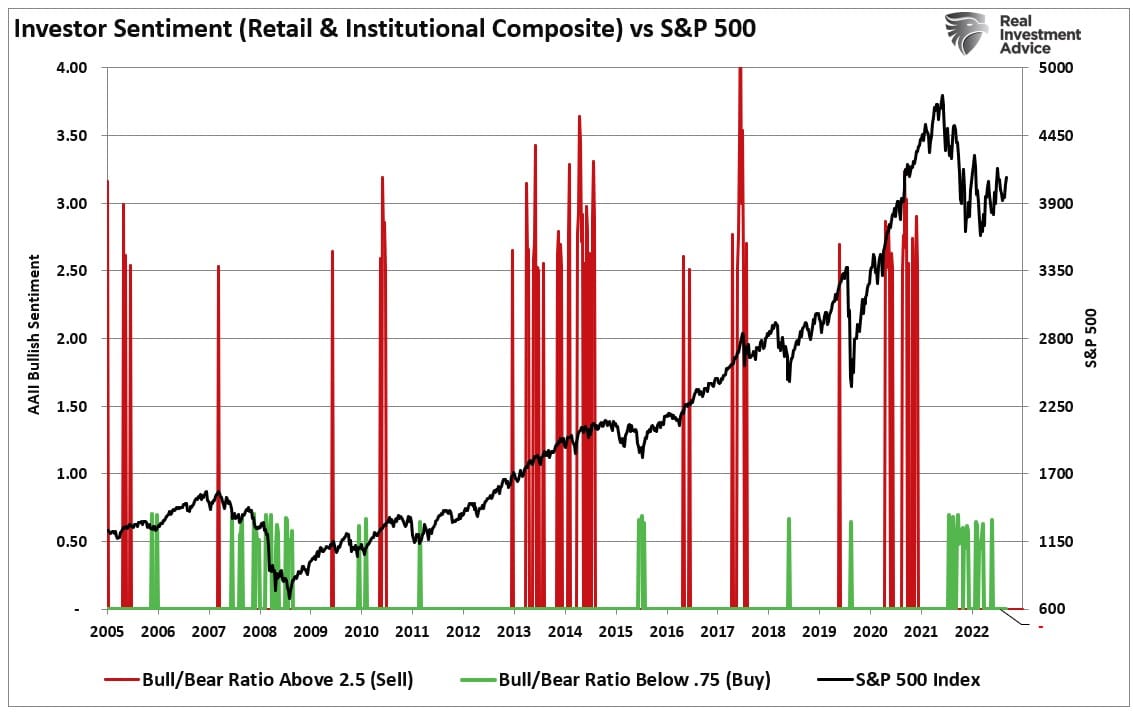
The chart below is a weekly composite index of investor sentiment. It only shows periods when investors are extremely bullish or bearish compared to the S&P 500 index.
Using sentiment as a timing indicator for investing isn’t advised, as extreme bullish or bearish sentiment can last for extended periods as price momentum trends higher or lower. However, understanding that extreme bullishness or bearishness tends to denote market excesses is essential to temper our emotional biases.
Most importantly, as investors, we need to recognize that while bullishness or bearishness at extremes is often wrong, investor sentiment is often correct in the middle of the trend.
When Investing, Star Wars Is Wrong
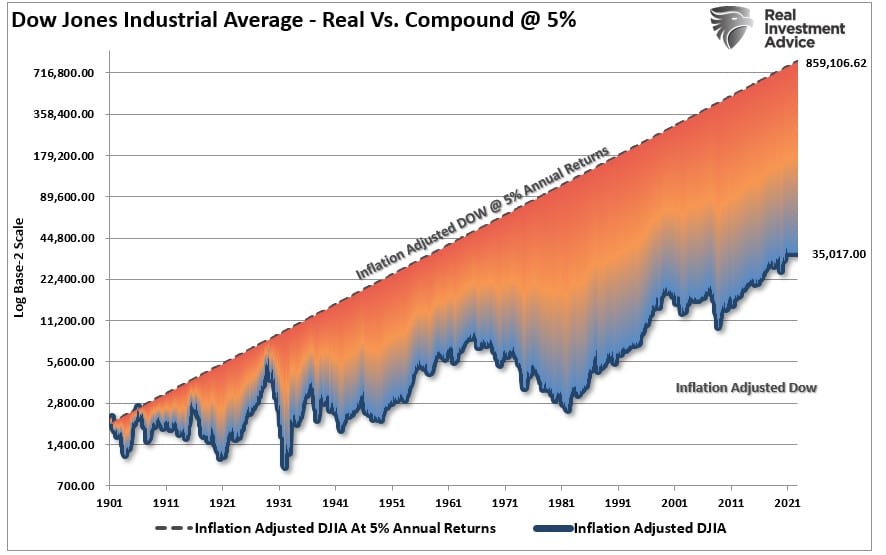
There are numerous scenes in the Star Wars films when characters are told to“search their feelings” to discover what they know to be true.The problem is that, as humans, we tend to extrapolate temporary events as permanent trends, mainly when investing. When markets rise, we believe the current trend will last indefinitely. When markets fall, they must be going to zero. Neither is true and is also the “fallacy” behind “buy and hold” investing and “compounded” market returns.
A brief review of market history shows that markets neither rise nor fall indefinitely, and periods of bullishness always lead to bearishness eventually. The chart shows the difference between the Dow Jones Industrial Average’s real value and what it would be if it grew at 5% annually (the buy and hold premise). The difference in ending values is due to the periods of falling returns reversing the previous periods of growth. Crucially, periods of declining values destroy the compounding effect.
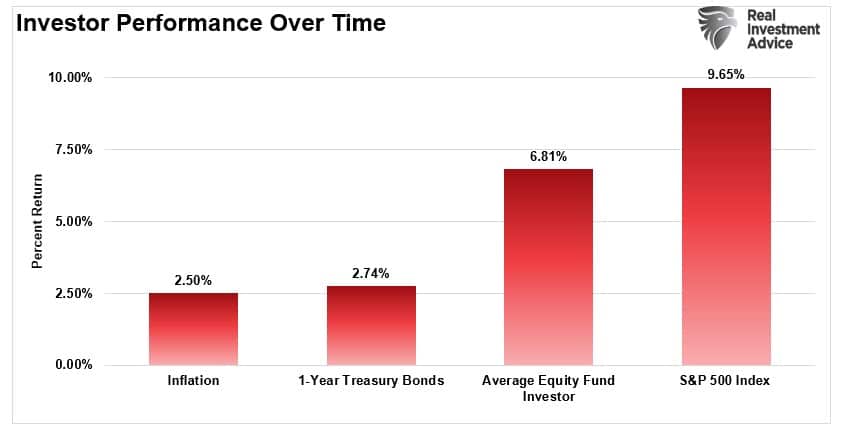
However, while that differential between outcomes is terrible enough, the reality is far worse due to investors’ emotional bias. Each year, Dalbar produces an investor survey that reveals the average investors’ performance versus the market’s returns. To wit:
“The bar chart below shows the difference in performance as well as the growth of $100,000 between the average equity investor and the S&P 500 Index for the past 30 years (through 2022). It also compares the average annualized return of such an initial investment to the rate of inflation and a short-term bond index over that same period.“
Dalbar explains well why a reasonably significant performance differential exists between the average investor and the market.
“This research series studies investor performance in mutual funds. Its goal is to show how investors can improve portfolio performances by managing behaviors that cause them to act imprudently.
If you’ve been following Dalbar’s research over the years, you know that one consistent theme keeps cropping up. Namely, the set of longer-term data analyzed in these QAIB reports clearly shows that people are, more often than not, their own worst enemies when it comes to investing.
Often succumbing to short-term strategies such as market timing or performance chasing, many investors show a lack of knowledge and/or ability to exercise the necessary discipline to capture the benefits markets can provide over longer time horizons. In short, they too frequently wind up reacting to market maturations and lowering their longer-term returns.”
To simplify that analysis, investors succumb to their emotions of either bullishness or bearishness, often at the moment when an opposite action should be taken.
At the outset, I noted many negative headlines, prognostications, and a slew of data suggesting poor outcomes for equity markets. However, bullishness is rising contrary to what logic suggests.
Therefore, how should we consider current investor sentiment in our portfolio management process?
Right In The Middle, Wrong At Both Ends
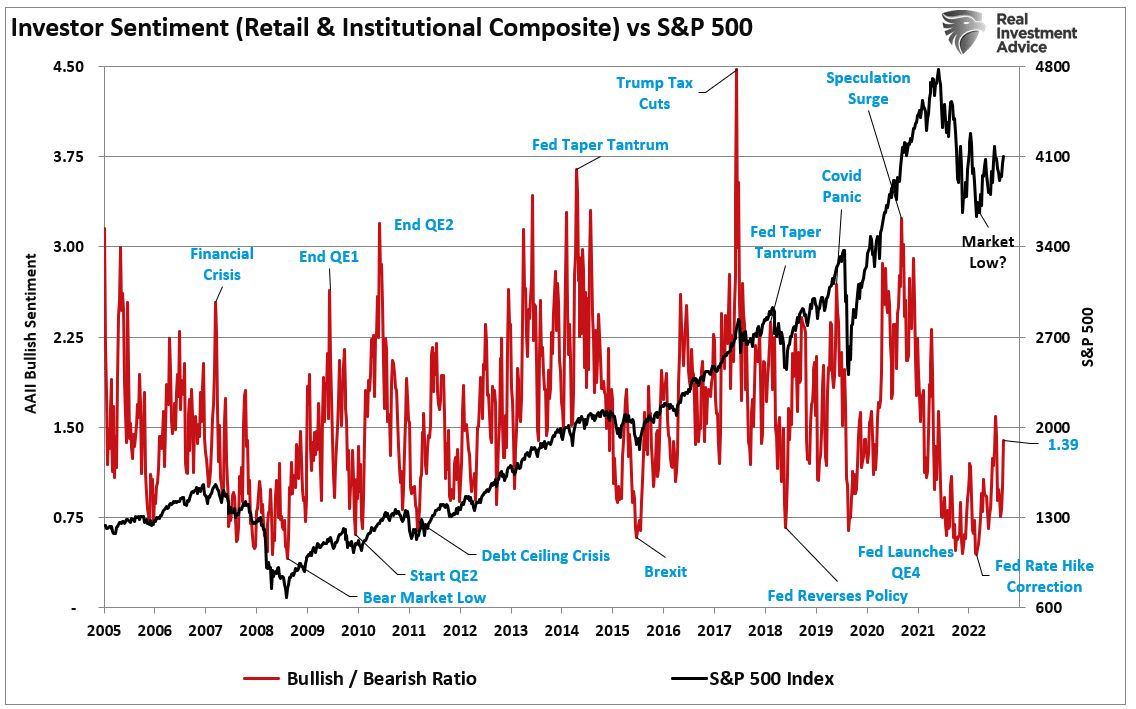
As noted, investor sentiment, either bullish or bearish, tends to be right in the middle but wrong at extremes. If we revisit our weekly composite sentiment index, we see it is rising from an extreme low.
Reviewing the 2008 period, we see that sentiment can remain low for an extended period. However, once it rises more consistently, such tends to mark the equity market low. Such may be what we are seeing now.
However, while individuals succumb to emotions dictating investing actions, professional investors suffer from the same bias. The National Association Of Active Investment Managers (NAAIM) represents its members’ average exposure to U.S. equity markets. Historically, when that index falls below 40% exposure, such aligns with market bottoms (conversely, above 90% aligns with market peaks.)
Another measure of sentiment, the volatility index (VIX), also suggests the market low was in October. Extreme VIX readings occur at or near market lows as extreme “panic” drives selling. Bull markets are typically defined by a declining VIX from a previous peak. The 2022 selloff was a “correction” within an ongoing bull market because the VIX peaked around 30. With that index back on the decline, such also suggests that October was the correction low.
Excessive bullishness is missing, while extreme bearishness is fading but still prevalent.
Is the current rally since the beginning of the year a return of the bull market? Maybe. It could also be a “bear market rally” sucking investors back in before “the next shoe falls.”
Unfortunately, we won’t know until after the fact. However, rising bullishness from extremely low readings has often suggested a more protracted market advance “climbing a wall of worry.”
As Stephan Cassaday once quipped:
“More money has been lost trying to avoid bear markets than has been lost in any bear market.”
While it is easy to allow the many headlines, podcasts, and media prognostications to spin up our “emotional biases,” it is essential to remain focused on what the market is doing versus what we “think” it should be.
TORONTO – Canada’s main stock index was up more than 100 points in late-morning trading, helped by strength in base metal and utility stocks, while U.S. stock markets were mixed.
The S&P/TSX composite index was up 103.40 points at 24,542.48.
In New York, the Dow Jones industrial average was up 192.31 points at 42,932.73. The S&P 500 index was up 7.14 points at 5,822.40, while the Nasdaq composite was down 9.03 points at 18,306.56.
The Canadian dollar traded for 72.61 cents US compared with 72.44 cents US on Tuesday.
The November crude oil contract was down 71 cents at US$69.87 per barrel and the November natural gas contract was down eight cents at US$2.42 per mmBTU.
The December gold contract was up US$7.20 at US$2,686.10 an ounce and the December copper contract was up a penny at US$4.35 a pound.
This report by The Canadian Press was first published Oct. 16, 2024.
TORONTO – Canada’s main stock index was up more than 200 points in late-morning trading, while U.S. stock markets were also headed higher.
The S&P/TSX composite index was up 205.86 points at 24,508.12.
In New York, the Dow Jones industrial average was up 336.62 points at 42,790.74. The S&P 500 index was up 34.19 points at 5,814.24, while the Nasdaq composite was up 60.27 points at 18.342.32.
The Canadian dollar traded for 72.61 cents US compared with 72.71 cents US on Thursday.
The November crude oil contract was down 15 cents at US$75.70 per barrel and the November natural gas contract was down two cents at US$2.65 per mmBTU.
The December gold contract was down US$29.60 at US$2,668.90 an ounce and the December copper contract was up four cents at US$4.47 a pound.
This report by The Canadian Press was first published Oct. 11, 2024.
TORONTO – Canada’s main stock index was little changed in late-morning trading as the financial sector fell, but energy and base metal stocks moved higher.
The S&P/TSX composite index was up 0.05 of a point at 24,224.95.
In New York, the Dow Jones industrial average was down 94.31 points at 42,417.69. The S&P 500 index was down 10.91 points at 5,781.13, while the Nasdaq composite was down 29.59 points at 18,262.03.
The Canadian dollar traded for 72.71 cents US compared with 73.05 cents US on Wednesday.
The November crude oil contract was up US$1.69 at US$74.93 per barrel and the November natural gas contract was up a penny at US$2.67 per mmBTU.
The December gold contract was up US$14.70 at US$2,640.70 an ounce and the December copper contract was up two cents at US$4.42 a pound.
This report by The Canadian Press was first published Oct. 10, 2024.