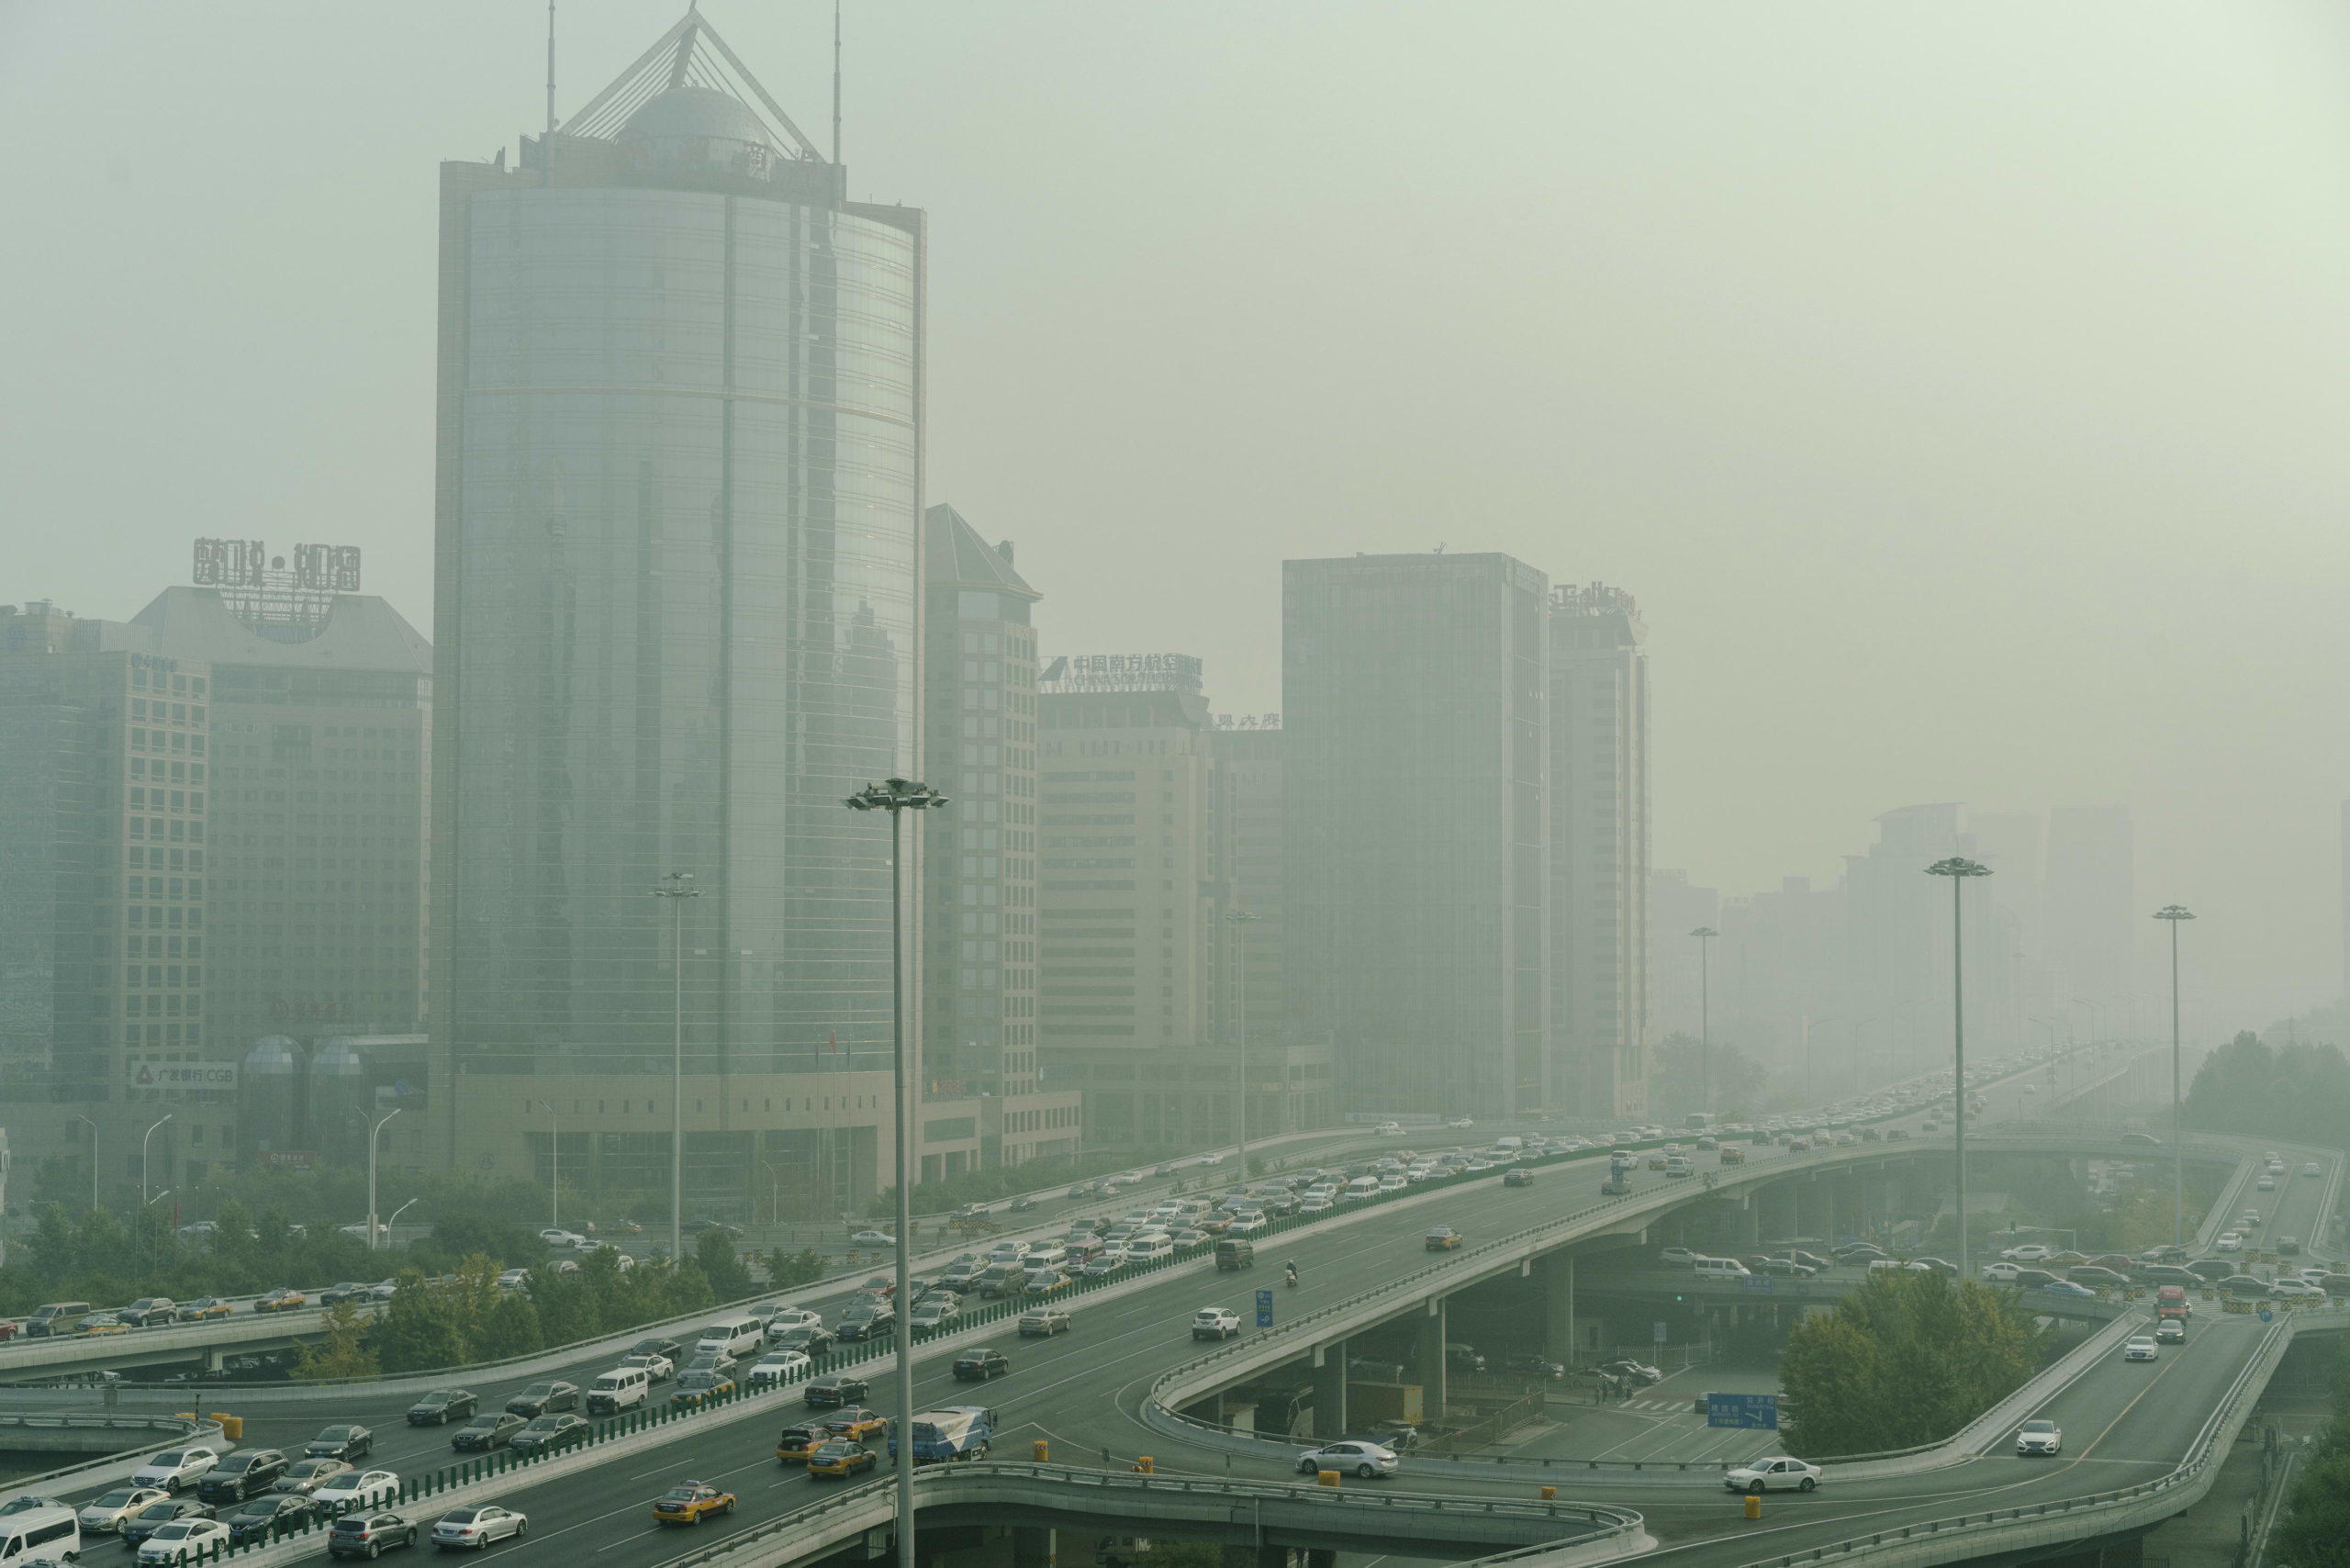
Office buildings amid the heavy haze at Beijing’s business district, in a photo from 2017.
Zhang Peng | Contributor
All eyes are on China’s progress in getting its factories to crank up again, after the country extended this year’s Lunar New Year holiday and shut down major growth regions in a bid to contain the coronavirus outbreak.
Many of its provinces started gradually limping back to some form of production last week, about two weeks later than previous years.
The Chinese government has also been giving regular updates, reporting last Wednesday that work resumption rate has topped 50% for some industrial companies in key economic regions such as Guangdong and Shanghai.
Chinese state media also reported Tuesday that more than 80% of its central state-owned companies’ roughly 20,000 manufacturing subsidiaries have resumed work.
But here’s how some economists and analysts are tracking the story of China’s progress in returning to work — as the world’s second largest economy gears up to return to full production.
Air pollution levels, coal consumption
Analysts are using pollution levels as a gauge of industrial activity. Major cities in China are well known for being choked by smog, due to the extensive burning of coal by factories.
So far this year, pollution levels have been between 20% and 25% lower compared to the same period last year, Tapas Strickland of National Australia Bank (NAB) said in a note earlier last week, suggesting there was a substantial decline in industrial activity in the first quarter.
Referring to the official update that more than 80% of China’s 20,000 manufacturing subsidies have resumed work, Rodrigo Catril, senior foreign exchange strategist at NAB, cast doubt on the actual progress.
“This news should have been embraced warmly by the market, however high frequency data such as pollution levels and traffic congestion gauges in Beijing do not at this stage corroborate the upbeat official message, keeping investors wary,” he said in a note Wednesday.
On Feb. 20 (Thursday), daily coal consumption of six major power plants was 42.5% less than the same time last year, according to Nomura, which has been tracking such metrics daily. The Japanese bank has also been following data on traffic congestion, passenger flows and new home sales in a bid to track the progress of China’s work resumption.
“The pace was slow due to a lack of workers and strict reopening criteria, and it varied across cities, industries, and firms,” J.P. Morgan’s Sin Beng Ong wrote in a note last week.
“The weak resumption of production is reinforced by a set of high-frequency indicators in the areas of energy consumption, real estate transactions, passenger traffic, and air quality,” he said.
Passenger migration across China
Other metrics — such as traffic congestion and passenger numbers — could also shed some clues on the full picture of China’s return to work.
“The Baidu migration index suggests that only 37% and 33% of people that left tier-1 and key tier-2 cities for LNY have returned (vs. 100% at this point last year),” Morgan Stanley analysts wrote last week. large
According to Nomura, the worker return rate for 15 cities was 25.6% as of Feb. 19, only around a quarter of what was recorded a year ago.
However, Oxford Economics pointed out in a note on Thursday that such gauges do not completely reflect the full back-to-work progress, as they don’t take into account the practice of working from home amid the virus crisis.
“Pollution and traffic volume statistics provide one guide to the speed at which China is returning to business as usual,” the advisory firm said.
“But they’re imprecise indicators of activity growth and will fail to fully capture shifts in spending and activity (e.g., greater online spending and remote working),” it said, adding that the first gauge will “come from the business surveys of sentiment.”
TORONTO – Strength in the base metal and technology sectors helped Canada’s main stock index gain almost 100 points on Friday, while U.S. stock markets also climbed higher.
The S&P/TSX composite index closed up 93.51 points at 23,568.65.
In New York, the Dow Jones industrial average was up 297.01 points at 41,393.78. The S&P 500 index was up 30.26 points at 5,626.02, while the Nasdaq composite was up 114.30 points at 17,683.98.
The Canadian dollar traded for 73.61 cents US compared with 73.58 cents US on Thursday.
The October crude oil contract was down 32 cents at US$68.65 per barrel and the October natural gas contract was down five cents at US$2.31 per mmBTU.
The December gold contract was up US$30.10 at US$2,610.70 an ounce and the December copper contract was up four cents US$4.24 a pound.
This report by The Canadian Press was first published Sept. 13, 2024.
OTTAWA – Statistics Canada says wholesale sales, excluding petroleum, petroleum products, and other hydrocarbons and excluding oilseed and grain, rose 0.4 per cent to $82.7 billion in July.
The increase came as sales in the miscellaneous subsector gained three per cent to reach $10.5 billion in July, helped by strength in the agriculture supplies industry group, which rose 9.2 per cent.
The food, beverage and tobacco subsector added 1.7 per cent to total $15 billion in July.
The personal and household goods subsector fell 2.5 per cent to $12.1 billion.
In volume terms, overall wholesale sales rose 0.5 per cent in July.
Statistics Canada started including oilseed and grain as well as the petroleum and petroleum products subsector as part of wholesale trade last year, but is excluding the data from monthly analysis until there is enough historical data.
This report by The Canadian Press was first published Sept. 13, 2024.
TORONTO – Canada’s main stock index was up more than 150 points in late-morning trading, helped by strength in the base metal and energy sectors, while U.S. stock markets were mixed.
The S&P/TSX composite index was up 172.18 points at 23,383.35.
In New York, the Dow Jones industrial average was down 34.99 points at 40,826.72. The S&P 500 index was up 10.56 points at 5,564.69, while the Nasdaq composite was up 74.84 points at 17,470.37.
The Canadian dollar traded for 73.55 cents US compared with 73.59 cents US on Wednesday.
The October crude oil contract was up $2.00 at US$69.31 per barrel and the October natural gas contract was up five cents at US$2.32 per mmBTU.
The December gold contract was up US$40.00 at US$2,582.40 an ounce and the December copper contract was up six cents at US$4.20 a pound.
This report by The Canadian Press was first published Sept. 12, 2024.