The lockdown of Wuhan on 23 January 2020 was considered an early milestone in the battle against the novel coronavirus. There is no precedent in China’s modern history for adopting such strict isolation measures in a city with more than ten million people. China also simultaneously adopted nationwide actions of detection, tracking, and isolation, making extensive use of digital tools in support of the effort. In retrospect, those measures were taken when the pandemic situation could have been considered ‘mild.’ At that time, China had only 571 confirmed cases, 425 of which were in Wuhan.
Since then, dramatic and largely unforeseen changes have taken place globally in the past five months. On the pandemic side, by 1 July 2020, the number of confirmed cases worldwide had exceeded 10 million and more than 510,000 suffered death. 3 July 2020 marked the date when newly confirmed cases globally exceeded 200,000. At least 13 countries have more than 200,000 people with confirmed infections. The total number of confirmed cases in China is 84,785, once considered a large crisis number, but now only about 3% of the cases in the US and 6% in Brazil. Adjusting for population size, it can be said that the magnitude of epidemic, from the first wave of East Asian economies, the second wave of European and American countries, to the third wave of the rest of the world, has grown more than a hundred times in many countries and regions. With the number of confirmed cases worldwide exceeding 10 million, the fact that still makes people feel incredulous is the explosive speed of the spread and the scale and scope of the impact of the novel coronavirus on health and economies.
On the economic side, many countries, including the US and UK, have predicted that their economies are encountering the worst recession since the Great Depression. Back in January, the IMF predicted that the global economy would grow by 3.3% in 2020; the number was adjusted to -3% in May and then -4.9% in June. Further downward revisions are a distinct possibility. Many people are gradually accepting that the economic recovery will not be V-type, but more likely L-type, at most a long and challenging asymmetric U. After the early turbulence, global stock markets have recovered quite a lot showing strong optimism. This disconnect between economic outcomes and stock market valuations continues to puzzle experts and others alike.
It is probably time to reflect on what lessons we have learned and how to digest the current situation. We still have a long way to return to some version of normal. We summarise some of the trends and lessons as follows:
Trend one: Pandemanomics
The world has currently remains in the stage characterised by pandemic economy. Mobility derived from the impact of “distancing, as well as more aggressive measures like stay at home orders and mandatory business closures” has become one of the most effective indicators to explain the economic activity.
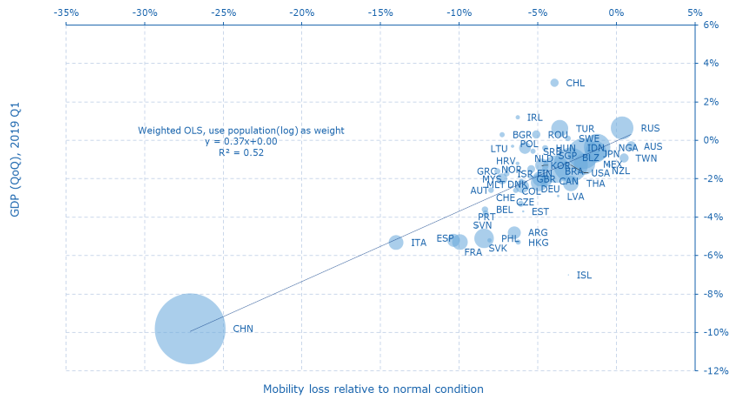
There is a strong relationship between mobility and economic performance. In the first quarter of 2020, for 54 economies with data available, more than half of the cross-regional GDP growth variation can be captured by average mobility during the quarter (Figure 1, visit here for detailed definitions and descriptions). Intuitively, mobility can be affected by either distancing policies or people’s conscious, risk-averse choices, thus summarising the compound impact of the pandemic. Mainland China in the first quarter is at the bottom left of the figure, reflecting the fact that the virus had already influenced China’s first-quarter GDP for more than two months. Because the economic contractions of many economies started nearer the end of the first quarter, it can be expected that the economic performance of many economies will change dramatically in the second quarter, while the relationship between mobility and economic performance remains strong.
Figure 1 GDP growth and mobility across 54 economies in the first quarter of 2020 (bubble size indicates the population of an economy)
Source: Bloomberg, Wind, CEIC, Google, Baidu, Luohan Academy. GDP data are seasonally adjusted.
The strong relationship between mobility and economic performance holds true not only across economics, but also across regions within an economy, or across time for the same economy. Take China as an example: during the first quarter of 2020, about 60% of the consumption contraction across 297 cities, calculated in the Luohan Academy’s economic recovery index, can be explained by mobility contraction (Figure 2). Similarly, during January 2002-March 2020, there is a strong relation between the Chicago Fed’s National Activity Index and Passenger Transportation Service Index. It is also clear that the level of both mobility and activity contractions is much worse than the financial crisis of 2008.
Figure 2 Mobility and economic performance across regions and through time in the cases of China and the US
Panel a Mobility and consumption loss of cities in China (2020Q1)
Panel b Mobility and economic activity of United States (January 2001 – March 2020)
Source: Federal Reserve Bank of Chicago, U.S. Bureau of Transportation Statistics, Baidu, Luohan Academy.
Trend two: Speed
The more decisive and faster a government’s distancing policy, the lower the degree of infection and the smaller the final economic loss. However, if an economy misses the initial policy reaction period, it often faces difficult tradeoffs between pandemic control and economic losses.
The faster an economy’s isolation policy is, the lower the number of people infected will be. Take the East Asian, European and North American economies that were affected by the first and second waves of the pandemic as examples. If we use the length of time (in days) between an economy’s first confirmed case and its maximum intensity of isolation policy as the measure of policy response speed, we can see that the policy speed varies greatly (Figure 3). Mainland China, Taiwan, New Zealand and Norway all reached their highest point of policy strength in less than 30 days. On the contrary, Sweden spent more than 120 days. The faster the policy is, the fewer people are infected per million people. On average, about 70 people are infected per 1 million people in the world, but the differences are large, with an average of 10 people in Asia, 255 in Europe, 367 in North America, and 177 thus far in Latin America. Among European countries, Norway has 47 people infected per million people, Britain 653 people and Sweden 516 people.
Figure 3 Speed of policy response and epidemic severity
Source: Oxford Coronavirus Government Response Tracker, Johns Hopkins University, Luohan Academy. Data is by June 24th.
Two facts become clear: First, based on public data, the global average infection mortality rate caused by novel coronavirus is more than 5%, far exceeding the approximately 0.1% mortality rate caused by common influenza. Even though there could be a lot of measurement error in the mortality rate, it has become increasingly clear that the concept of group immunity, which was still hotly discussed by various countries in March 2020, was actually not a policy option and had a misleading effect. Early on, countries considered treating the novel coronavirus as influenza, including UK, Sweden and the US, eventually face higher deaths.
Second, there is a window period to control the spread of the epidemic. The slower the implementation of the isolation policy, the higher the cost in terms of infections per million in the population and loss of life.
Policy speed not only affects the severity of the pandemic, but also directly affects the economy. Based on the empirical relationship between mobility and economic performance in the first quarter, assuming that the same relationship still holds in the second quarter, we can compare the relation between the projected economic performance and policy speed of each economy in the second quarter. The faster the policy responds, the smaller the economic losses the corresponding economies will bear (Figure 4).
The intuition is not difficult to understand, but it is worth pondering. Recall that economic losses or damages are determined by the magnitude of the economic contraction and its duration. Some governments implemented slow epidemic control policies with the hope of stemming economic losses. However, because not controlling the epidemic situation is not a feasible option, almost all the economies were forced to intensify policies to reduce the economic activity. Therefore, a slower response speed tends to lead to higher economic losses.
Figure 4 Policy response speed and economic contraction
Source: Pandemic Economy Tracker (PET) project by Luohan Academy, Oxford Coronavirus Government Response Tracker, Johns Hopkins University. Note Sweden is not included in drawing the fitting line in the figure. Data are by June 24th.
Sweden is at least a temporary exception. Unwilling to implement strict distancing policies, on one hand, it saw more infections and deaths than most comparable European countries. On the other hand, due to slower economic contraction, the economic loss in the second quarter will be lower than that in other European countries. The problem now is that, because the speed of epidemic spread in Sweden (manifested as the number of days required to double the confirmed population) is still far faster than other European countries, it might be more difficult for Sweden to recover its economy quickly. In the long run, it is still unclear whether Sweden’s cumulative economic losses will be lower than other countries.
In addition to policy speed, another dimension is policy strength. In Figure 5, for 131 economies tracked by Luohan Academy, we use the size of bubbles to represent the number of confirmed cases per million people. In general, the bubbles on the left side of the figure are smaller than those on the right side, indicating that the faster the policy is, the fewer the number of infected cases will be. Some countries in the upper left corner also showed a relatively high number of confirmed cases. We found that many of the countries in that corner were ones affected by the third wave of epidemic. Due to limited ability to detect and track cases, even if they adopt fast and strong distancing policies, it is not necessarily true that they can have the most effective control of the epidemic. On the right side of the figure, when the best period for policy implementation is missed, the number of confirmed cases is higher. In this case, because the epidemic base has deteriorated, stronger policy efforts may not necessarily bring about a lower number of confirmed cases. Therefore, the lesson here is that the speed of policies is more important than the intensity.
Figure 5 Policy speed, intensity, and virus control
Source: Oxford Coronavirus Government Response Tracker, Johns Hopkins University, Luohan Academy. The graph is separated by the medium of the two policy dimensions. Data is by June 24th.
Policy strength has a noticeable impact on the economy, because intensified policy strength will inevitably bring about economic contraction for the corresponding period. It is unclear whether the cumulative economic effect of a fast-and-strong policy response will be larger or smaller than a slow-and-light policy response. In Figure 6, we use the size of bubbles to represent the average economic losses in the second quarter. The lower-left corner of the figure shows economies with faster policy speed and relatively lighter intensity. This combination does the least harm to the economy.
On the contrary, a more rigid policy will lead to substantial economic losses. However, an interesting question is presented. If the initial policy response window is missed, to ease economic losses, should a country adopt a strong or loose isolation policy? This is the comparison between the upper right corner and the lower right corner. It can be seen that the economic loss of the former in the second quarter is higher than that of the latter. However, in the long run, it is difficult for the latter to recover its economy quickly due to the slack control of the epidemic situation, as shown by some states in the US. It is, therefore, unclear whether the latter will suffer smaller economic losses in the long run.
Figure 6 Policy speed, intensity, and economic loss for 131 economies
Source: PET project by Luohan Academy, Oxford Coronavirus Government Response Tracker, Johns Hopkins University. Data is by June 24th.
The relationship between policy, epidemic control, and economic performance is now clear. First, policy speed matters most. If policy implementation is fast and coupled with detection and tracking abilities, an economy may quickly control the number of infected people without much economic contraction. The result is that the numbers of infected people and economic losses are low.
For countries that missed the best implementation period of the policy, the number of infected people is higher. It is often necessary to make a painful choice between the number of infected people and economic contraction. If the virus containment policy is strong it is less likely that the number of infected people will be large, but the cost is a greater economic contraction, at least in the short run. Those countries that try to postpone the policy and limit policy strength have suffered a high number of infections and deaths, but whether they can control the extent of economic losses in the long run is still unclear.
Trend three: Size
While different economies’ performance varies in no small degree, it has been more difficult for highly populated economies to navigate through the pandemic economy.
The key to navigating through the pandemic economy effectively is to implement distancing policies to control the pandemic situation quickly and restore the economy based on sustainable pandemic control. Among the top 30 economies accounting for 84% of global GDP, only 14 are currently in the recovery period (Figure 7), a recovery ratio lower than the global average. Those still in the trough period that do not qualify for the recovery phase, which we define as at least three consecutive days during which the newly confirmed infections are lower than the newly recovered, include not only some advanced economies such as the US, but also some important emerging economies, such as Brazil, India, Russia, South Africa, and some regional developing countries, such as Pakistan, Indonesia, Bangladesh, Mexico, Argentina, Egypt, Nigeria, etc.
Figure 7 Tracking the pandemic economy performance of top 30 economies
Source: PET project by Luohan Academy
Different economies vary considerably in their handling of the pandemic economy, and the results also differ correspondingly. Some countries affected by the second wave of the epidemic, such as Egypt, Saudi Arabia, and the US, still have insufficient pandemic control and are mixed with the third wave of countries. By contrast, some countries affected by the third wave, such as Vietnam and Thailand, have more effective pandemic control and economic recovery than most countries affected by the second wave.
Trend four: Capital markets – The reaction of the capital markets reveals the markets’ expectation of the progress of the pandemic economy.
The stock market is forward-looking. During the period from one month before the first confirmed case in each economy to 24 June 2020, the stock markets of most economic entities have fallen (Figure 8). Among them, the decline is deeper for economies with more confirmed cases. Interestingly, from the date of the first confirmed case in each economy to June 24th, stocks in most economies have rebounded sharply, scoring positive returns, suggesting that the most prominent market declines occurred or began during the month preceding the first confirmed case. Also, the stock market increase since the first confirmed case is more significant for economies with fewer confirmed cases per million population.
Figure 8 Pandemic severity and stock performance
Panel a Epidemic severity and stock market performance relative to one month before the emergency response phase
Panel b Epidemic severity and stock market performance relative to the start of the emergency response phase
Source: PET project by Luohan Academy, Wind, Johns Hopkins University.
There is evidence on economic performance that can be consistent with, if not justify, the optimism in the stock markets. Compared with the lowest point of economic contraction brought about by the isolation policy, these economies have all experienced different degrees of economic activity recovery, due to relaxation of distancing policies (Figure 9). Many people have been worried that most economies will stay at the L-shaped situation for a long time but now it seems that many countries have improved a lot compared with the lowest point. Although it will take a long time to recover to the pre-pandemic levels, many economies are experiencing an asymmetric V-shaped turning as shown by the PET curve (Figure 7). We can think of at least four reasons why the capital markets are so upbeat. One reveals its expectation on the trajectory of a part of the economic recovery. The second is the strong stimulus policies of various countries. Third, monetary policies have lowered interest rates and the discount rate, thereby increasing the weight attached to post-pandemic earnings flows. Finally, the acceleration of digital technology adoption during the pandemic also drives the capital markets, because of the large and increasing weight attaching to these companies in the indices.
That said, one can at least wonder, given the global evolution of the pandemic economy to date and the considerable remaining uncertainty around recovery paths, whether the risk premia are high enough. In addition, there are parts of the economy such as tourism and hospitality sectors, which are underrepresented in the indices, and are arguably experiencing greater contractions in activity and employment than the average for the overall economy. And of course, other dimensions of well-being not reflected in standard economic data may also be underperforming. There is evidence that the pandemic economy has had adverse distributional effects, acting somewhat like a regressive tax. Economic and food security have suffered in some economies where the safety nets are inadequate or not functioning properly because of implementation challenges.
Figure 9 Economic activity change since the lowest trough point and stock market response
Source: PET project by Luohan Academy, Wind, and Johns Hopkins University. Note the fitting line is drawn without considering the diamond points.
We observe a similar relationship between pandemic severity and the exchange rate. For selected emerging economics, the worse the number of confirmed cases per million population, the more the depreciation of an economy’s currency relative to US dollars (Figure 10).
Figure 10 Pandemic severity and exchange rate change among emerging economies
Source: PET project by Luohan Academy, CEIC, Invseting.com, and Johns Hopkins University.
Trend five: Emerging and developing economy challenges
What should be of grave concern are the economies affected by the third wave of the pandemic. Many are suffering tremendous economic loss and yet have not adequately controlled the epidemic.
Despite earlier warning signs coming from experience in first and second wave countries, many of the economies affected by the third wave missed the best period of policy responses and are now dealing with severe pandemic and economic pressures. These economies usually do not have adequate capabilities to detect, track, and isolate infected cases, nor is it easy for them to sustain the cost of economic contraction. The capacity of the medical systems may be strained in case of severe virus spread.
Latin America is a typical example (Figure 11). Starting from the beginning of their economic contraction, Uruguay, Brazil and Argentina have all entered the pandemic economy for about 15 weeks. Yet the ability to control the epidemic situation varies greatly. It took Uruguay more than 70 days to double the number of confirmed cases, and the death toll per million people is only 7.8. In contrast, Brazil sees its confirmed cases double in about 20 days, which indicates a dangerous situation with potential repeated outbreaks, and the death toll per million people reached 273. Argentina is in a similar situation as Brazil, though the death toll is lower. Both economies have not yet found an effective policy that can lead them to navigate steadily upward and to the right, the desired course for the pandemic curve.
Figure 11 The pandemic economy tracker (PET) for selected Latin American economies
Source: Luohan Academy. For detailed description and daily updates of PET curves, visit its dashboard.
Among the Asian countries suffering from the third wave of the epidemic (Figure 12), Vietnam’s economic activity has recovered successfully to the level before the pandemic. Recently, they announced a positive year-on-year economic growth in the second quarter. It takes more than 90 days for its confirmed cases to double, indicating effective control of the pandemic. In contrast, India and the Philippines are in a similar situation as Brazil and Argentina. They have not found effective ways to restore the economy under the control of the epidemic.
Figure 12 The PET curve for selected Asian economies affected by the third wave
Equally worrisome, if not more, are African countries affected by the third wave. The epidemic situation in many African countries is still deteriorating rapidly (Figure 13). South Africa’s economic recovery is at the cost of accelerating the spreading of the epidemic, it now only takes slightly more than ten days to double the confirmed cases. Nigeria is also in an unstable epidemic situation, and the sustainability of its economic recovery is in doubt. Rapid resurgence of the epidemic is occurring in Rwanda.
Figure 13 The PET curve for selected African economies affected by the third wave
Many lower-income economies with limited fiscal capacity to buffer the shock of a sustained lockdown, are clearly at risk both economically and in terms of virus containment. External help in expanding fiscal and medical capacity is clearly warranted and should be a high priority for the wealthier nations.
Conclusion
The global pandemic economy is far from over. The virus is spreading and confirmed cases have passed the 11 million mark. Policymakers across the world are making difficult decisions under extreme uncertainty as they balance economic and health outcomes in managing the co-evolution of the economy and the virus. We hope that real-time pandemic economy tracking (which can in many cases extend beyond regional and state levels) and the patterns described above may act as a useful tool for those charged with navigating the economies in this challenging environment. The simple truth is that coronavirus doesn’t discriminate. There are very real human costs, and in addition to the loss of life, there will be reduced economic activity, bankruptcies, or employment.
OTTAWA – The parliamentary budget officer says the federal government likely failed to keep its deficit below its promised $40 billion cap in the last fiscal year.
However the PBO also projects in its latest economic and fiscal outlook today that weak economic growth this year will begin to rebound in 2025.
The budget watchdog estimates in its report that the federal government posted a $46.8 billion deficit for the 2023-24 fiscal year.
Finance Minister Chrystia Freeland pledged a year ago to keep the deficit capped at $40 billion and in her spring budget said the deficit for 2023-24 stayed in line with that promise.
The final tally of the last year’s deficit will be confirmed when the government publishes its annual public accounts report this fall.
The PBO says economic growth will remain tepid this year but will rebound in 2025 as the Bank of Canada’s interest rate cuts stimulate spending and business investment.
This report by The Canadian Press was first published Oct. 17, 2024.
OTTAWA – Statistics Canada says the level of food insecurity increased in 2022 as inflation hit peak levels.
In a report using data from the Canadian community health survey, the agency says 15.6 per cent of households experienced some level of food insecurity in 2022 after being relatively stable from 2017 to 2021.
The reading was up from 9.6 per cent in 2017 and 11.6 per cent in 2018.
Statistics Canada says the prevalence of household food insecurity was slightly lower and stable during the pandemic years as it fell to 8.5 per cent in the fall of 2020 and 9.1 per cent in 2021.
In addition to an increase in the prevalence of food insecurity in 2022, the agency says there was an increase in the severity as more households reported moderate or severe food insecurity.
It also noted an increase in the number of Canadians living in moderately or severely food insecure households was also seen in the Canadian income survey data collected in the first half of 2023.
This report by The Canadian Press was first published Oct 16, 2024.
OTTAWA – Statistics Canada says manufacturing sales in August fell to their lowest level since January 2022 as sales in the primary metal and petroleum and coal product subsectors fell.
The agency says manufacturing sales fell 1.3 per cent to $69.4 billion in August, after rising 1.1 per cent in July.
The drop came as sales in the primary metal subsector dropped 6.4 per cent to $5.3 billion in August, on lower prices and lower volumes.
Sales in the petroleum and coal product subsector fell 3.7 per cent to $7.8 billion in August on lower prices.
Meanwhile, sales of aerospace products and parts rose 7.3 per cent to $2.7 billion in August and wood product sales increased 3.8 per cent to $3.1 billion.
Overall manufacturing sales in constant dollars fell 0.8 per cent in August.
This report by The Canadian Press was first published Oct. 16, 2024.