Today we’ll look at General Electric Company (NYSE:GE) and reflect on its potential as an investment. Specifically, we’ll consider its Return On Capital Employed (ROCE), since that will give us an insight into how efficiently the business can generate profits from the capital it requires.
Firstly, we’ll go over how we calculate ROCE. Then we’ll compare its ROCE to similar companies. Last but not least, we’ll look at what impact its current liabilities have on its ROCE.
What is Return On Capital Employed (ROCE)?
ROCE is a measure of a company’s yearly pre-tax profit (its return), relative to the capital employed in the business. All else being equal, a better business will have a higher ROCE. Overall, it is a valuable metric that has its flaws. Renowned investment researcher Michael Mauboussin has suggested that a high ROCE can indicate that ‘one dollar invested in the company generates value of more than one dollar’.
So, How Do We Calculate ROCE?
The formula for calculating the return on capital employed is:
Return on Capital Employed = Earnings Before Interest and Tax (EBIT) ÷ (Total Assets – Current Liabilities)
Or for General Electric:
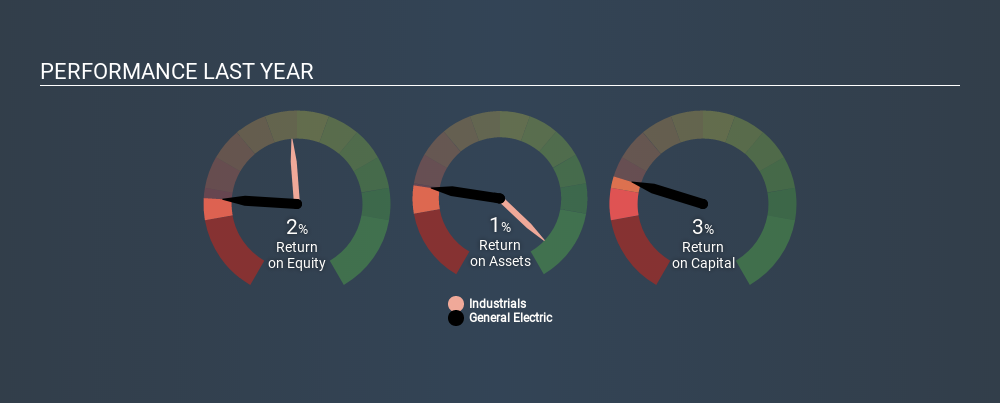
0.033 = US$7.0b ÷ (US$263b – US$48b) (Based on the trailing twelve months to September 2019.)
One way to assess ROCE is to compare similar companies. In this analysis, General Electric’s ROCE appears meaningfully below the 13% average reported by the Industrials industry. This performance is not ideal, as it suggests the company may not be deploying its capital as effectively as some competitors. Regardless of how General Electric stacks up against its industry, its ROCE in absolute terms is quite low (especially compared to a bank account). Readers may wish to look for more rewarding investments.
You can click on the image below to see (in greater detail) how General Electric’s past growth compares to other companies.
NYSE:GE Past Revenue and Net Income, December 31st 2019
Remember that this metric is backwards looking – it shows what has happened in the past, and does not accurately predict the future. Companies in cyclical industries can be difficult to understand using ROCE, as returns typically look high during boom times, and low during busts. ROCE is, after all, simply a snap shot of a single year. What happens in the future is pretty important for investors, so we have prepared a freereport on analyst forecasts for General Electric.
Do General Electric’s Current Liabilities Skew Its ROCE?
Current liabilities include invoices, such as supplier payments, short-term debt, or a tax bill, that need to be paid within 12 months. The ROCE equation subtracts current liabilities from capital employed, so a company with a lot of current liabilities appears to have less capital employed, and a higher ROCE than otherwise. To check the impact of this, we calculate if a company has high current liabilities relative to its total assets.
General Electric has total liabilities of US$48b and total assets of US$263b. As a result, its current liabilities are equal to approximately 18% of its total assets. This is a modest level of current liabilities, which will have a limited impact on the ROCE.
Our Take On General Electric’s ROCE
That’s not a bad thing, however General Electric has a weak ROCE and may not be an attractive investment. Of course, you might find a fantastic investment by looking at a few good candidates. So take a peek at this freelist of companies with modest (or no) debt, trading on a P/E below 20.
If you spot an error that warrants correction, please contact the editor at editorial-team@simplywallst.com. This article by Simply Wall St is general in nature. It does not constitute a recommendation to buy or sell any stock, and does not take account of your objectives, or your financial situation. Simply Wall St has no position in the stocks mentioned.
We aim to bring you long-term focused research analysis driven by fundamental data. Note that our analysis may not factor in the latest price-sensitive company announcements or qualitative material. Thank you for reading.
The easiest way to discover new investment ideas
Save hours of research when discovering your next investment with Simply Wall St. Looking for companies potentially undervalued based on their future cash flows? Or maybe you’re looking for sustainable dividend payers or high growth potential stocks. Customise your search to easily find new investment opportunities that match your investment goals. And the best thing about it? It’s FREE. Click here to learn more.
TORONTO – Canada’s main stock index was down more than 200 points in late-morning trading, weighed down by losses in the technology, base metal and energy sectors, while U.S. stock markets also fell.
The S&P/TSX composite index was down 239.24 points at 22,749.04.
In New York, the Dow Jones industrial average was down 312.36 points at 40,443.39. The S&P 500 index was down 80.94 points at 5,422.47, while the Nasdaq composite was down 380.17 points at 16,747.49.
The Canadian dollar traded for 73.80 cents US compared with 74.00 cents US on Thursday.
The October crude oil contract was down US$1.07 at US$68.08 per barrel and the October natural gas contract was up less than a penny at US$2.26 per mmBTU.
The December gold contract was down US$2.10 at US$2,541.00 an ounce and the December copper contract was down four cents at US$4.10 a pound.
This report by The Canadian Press was first published Sept. 6, 2024.
TORONTO – Canada’s main stock index was up more than 150 points in late-morning trading, helped by strength in technology, financial and energy stocks, while U.S. stock markets also pushed higher.
The S&P/TSX composite index was up 171.41 points at 23,298.39.
In New York, the Dow Jones industrial average was up 278.37 points at 41,369.79. The S&P 500 index was up 38.17 points at 5,630.35, while the Nasdaq composite was up 177.15 points at 17,733.18.
The Canadian dollar traded for 74.19 cents US compared with 74.23 cents US on Wednesday.
The October crude oil contract was up US$1.75 at US$76.27 per barrel and the October natural gas contract was up less than a penny at US$2.10 per mmBTU.
The December gold contract was up US$18.70 at US$2,556.50 an ounce and the December copper contract was down less than a penny at US$4.22 a pound.
This report by The Canadian Press was first published Aug. 29, 2024.
The crypto market has recently experienced a significant downturn, mirroring broader risk asset sell-offs. Over the past week, Bitcoin’s price dropped by 24%, reaching $53,000, while Ethereum plummeted nearly a third to $2,340. Major altcoins also suffered, with Cardano down 27.7%, Solana 36.2%, Dogecoin 34.6%, XRP 23.1%, Shiba Inu 30.1%, and BNB 25.7%.
The severe downturn in the crypto market appears to be part of a broader flight to safety, triggered by disappointing economic data. A worse-than-expected unemployment report on Friday marked the beginning of a technical recession, as defined by the Sahm Rule. This rule identifies a recession when the three-month average unemployment rate rises by at least half a percentage point from its lowest point in the past year.
Friday’s figures met this threshold, signaling an abrupt economic downshift. Consequently, investors sought safer assets, leading to declines in major stock indices: the S&P 500 dropped 2%, the Nasdaq 2.5%, and the Dow 1.5%. This trend continued into Monday with further sell-offs overseas.
The crypto market’s rapid decline raises questions about its role as either a speculative asset or a hedge against inflation and recession. Despite hopes that crypto could act as a risk hedge, the recent crash suggests it remains a speculative investment.
Since the downturn, the crypto market has seen its largest three-day sell-off in nearly a year, losing over $500 billion in market value. According to CoinGlass data, this bloodbath wiped out more than $1 billion in leveraged positions within the last 24 hours, including $365 million in Bitcoin and $348 million in Ether.
Khushboo Khullar of Lightning Ventures, speaking to Bloomberg, argued that the crypto sell-off is part of a broader liquidity panic as traders rush to cover margin calls. Khullar views this as a temporary sell-off, presenting a potential buying opportunity.
Josh Gilbert, an eToro market analyst, supports Khullar’s perspective, suggesting that the expected Federal Reserve rate cuts could benefit crypto assets. “Crypto assets have sold off, but many investors will see an opportunity. We see Federal Reserve rate cuts, which are now likely to come sharper than expected, as hugely positive for crypto assets,” Gilbert told Coindesk.
Despite the recent volatility, crypto continues to make strides toward mainstream acceptance. Notably, Morgan Stanley will allow its advisors to offer Bitcoin ETFs starting Wednesday. This follows more than half a year after the introduction of the first Bitcoin ETF. The investment bank will enable over 15,000 of its financial advisors to sell BlackRock’s IBIT and Fidelity’s FBTC. This move is seen as a significant step toward the “mainstreamization” of crypto, given the lengthy regulatory and company processes in major investment banks.
The recent crypto market downturn highlights its volatility and the broader economic concerns affecting all risk assets. While some analysts see the current situation as a temporary sell-off and a buying opportunity, others caution against the speculative nature of crypto. As the market evolves, its role as a mainstream alternative asset continues to grow, marked by increasing institutional acceptance and new investment opportunities.