Investment fees are easy to ignore. You don’t get billed for your advisor’s fee or the expense ratio of a mutual fund. They quietly take it out of your investment portfolio every quarter. Yet fees can have a huge impact on your wealth.
In this article, we are going to examine four aspects of investment fees. First, we’ll look at the numbers to see just how big an effect seemingly small fees can have on your wealth. Then we’ll consider whether high investment fees translate into better returns. Third, we’ll look at how to determine the investment fees you currently pay. And finally, we’ll look at a free tool that I use every day that includes an investment fee analyzer.
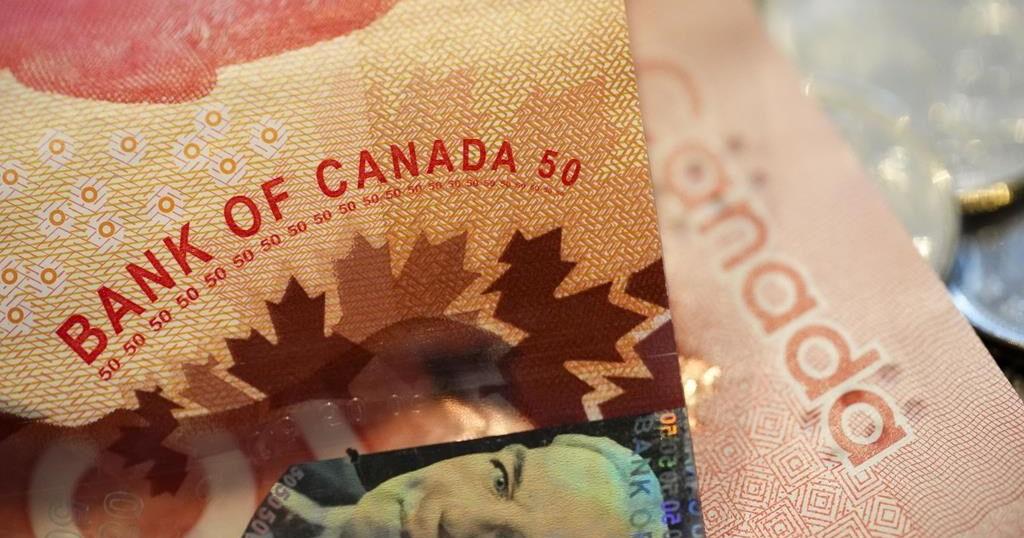
Investment Fees Matter
Even a 1% fee, over a lifetime of investing, can significantly reduce the value of a portfolio. Using Vanguard data, we know that from 1926 through 2019 an 80% stock and 20% bond portfolio returned 9.7% a year. Let’s imagine we invest $1,000 a month over a 40-year career. Using this savings calculator, we know that the portfolio would grow to about $5.8 million.
Yes, compounding is a beautiful thing.
Let’s now assume we pay an advisor 1% of our investments for their services. That’s a standard fee in the industry, although you can find less expensive and more expensive advisors. The result is that on an after fee basis, our returns drop from 9.7% to 8.7%. The result is a portfolio of just $4.3 million. The one percent fee cost us about $1.5 million, or 25% of our wealth.
Fees matter.
In the above example, we didn’t consider mutual fund fees. If our advisor invested our money in mutual funds that also charge a 1% expense ratio, our wealth would fall further, down to about $3.2 million.
High Fees Do Not Generate Better Returns
In defense of fees, some argue that higher fees generate better returns. Studies do not support this conclusion. A study by S&P Global published in 2020 found that actively managed funds underperformed their respective index over a 10-year period:
Large-cap funds made it a clean sweep for the decade—for the 10th consecutive one-year period, the majority (71%) underperformed the S&P 500. Their consistency in failing to outperform when the Fed was on hold (2010-2015) or raising (2015-2018) or cutting (2019) rates deserves special note. Of the large-cap funds, 89% underperformed the S&P 500 over the past decade.
The results for mid-cap and small-cap funds weren’t much better: “84% of mid-cap funds and 89% of small-cap funds underperformed over the longer 10-year period.”
Determining a mutual fund’s expense ratio is easy. As a starting point, a prospectus will include this information. Most 401k and other workplace retirement accounts should also provide this information. If you know the ticker symbol of the fund, you can also find the expense ratio on Morningstar. I have a video series that walks you through how to use Morningstar’s free tools.
Keep in mind that the expense ratio is not the only fee a mutual fund will charge. They also charge transaction fees that aren’t reflected in the expense ratio. That’s another reason to favor low-cost index funds. They tend to trade less frequently than actively managed funds, keeping transaction fees lower.
As for advisors, make sure you understand the fees they are charging you. If you don’t know what they are, ask.
Free Fee Analyzer Tool
Finally, there is a free tool you can use to evaluate your investment costs. It’s called Personal Capital. One feature of the tool is called the Retirement Fee Analyzer. Once you connect all of your investment accounts, the tool determines the expense ratios of all of your investments. It shows you this information for each fund and it calculates the weighted average expense ratio for your entire portfolio.
Beyond the data, Personal Capital also provides two tools to evaluate your investment fees. First, it compares your fees to a benchmark. Personal Capital uses 0.50% as its benchmark. More importantly, it shows how the fees will impact your wealth over time. Here’s what it looks like.
Personal Capital’s Retirement Fee Analyzer
Personal Capital
Keep in mind that the Fee Analyzer does not factor in any advisor fees you may be paying. It just looks at the expense ratios of the funds that are in your portfolio. If you pay an advisory fee, be sure to include that in your calculations.
Final Thoughts
It’s easy to forget about investment fees. Yet they are one of the most important aspects of investing. They are also a great indicator of returns. The lower the fees, the higher your returns, in most cases. That’s why index funds are such an important part of long-term investing.
TORONTO – Canada’s main stock index was down more than 200 points in late-morning trading, weighed down by losses in the technology, base metal and energy sectors, while U.S. stock markets also fell.
The S&P/TSX composite index was down 239.24 points at 22,749.04.
In New York, the Dow Jones industrial average was down 312.36 points at 40,443.39. The S&P 500 index was down 80.94 points at 5,422.47, while the Nasdaq composite was down 380.17 points at 16,747.49.
The Canadian dollar traded for 73.80 cents US compared with 74.00 cents US on Thursday.
The October crude oil contract was down US$1.07 at US$68.08 per barrel and the October natural gas contract was up less than a penny at US$2.26 per mmBTU.
The December gold contract was down US$2.10 at US$2,541.00 an ounce and the December copper contract was down four cents at US$4.10 a pound.
This report by The Canadian Press was first published Sept. 6, 2024.
TORONTO – Canada’s main stock index was up more than 150 points in late-morning trading, helped by strength in technology, financial and energy stocks, while U.S. stock markets also pushed higher.
The S&P/TSX composite index was up 171.41 points at 23,298.39.
In New York, the Dow Jones industrial average was up 278.37 points at 41,369.79. The S&P 500 index was up 38.17 points at 5,630.35, while the Nasdaq composite was up 177.15 points at 17,733.18.
The Canadian dollar traded for 74.19 cents US compared with 74.23 cents US on Wednesday.
The October crude oil contract was up US$1.75 at US$76.27 per barrel and the October natural gas contract was up less than a penny at US$2.10 per mmBTU.
The December gold contract was up US$18.70 at US$2,556.50 an ounce and the December copper contract was down less than a penny at US$4.22 a pound.
This report by The Canadian Press was first published Aug. 29, 2024.
The crypto market has recently experienced a significant downturn, mirroring broader risk asset sell-offs. Over the past week, Bitcoin’s price dropped by 24%, reaching $53,000, while Ethereum plummeted nearly a third to $2,340. Major altcoins also suffered, with Cardano down 27.7%, Solana 36.2%, Dogecoin 34.6%, XRP 23.1%, Shiba Inu 30.1%, and BNB 25.7%.
The severe downturn in the crypto market appears to be part of a broader flight to safety, triggered by disappointing economic data. A worse-than-expected unemployment report on Friday marked the beginning of a technical recession, as defined by the Sahm Rule. This rule identifies a recession when the three-month average unemployment rate rises by at least half a percentage point from its lowest point in the past year.
Friday’s figures met this threshold, signaling an abrupt economic downshift. Consequently, investors sought safer assets, leading to declines in major stock indices: the S&P 500 dropped 2%, the Nasdaq 2.5%, and the Dow 1.5%. This trend continued into Monday with further sell-offs overseas.
The crypto market’s rapid decline raises questions about its role as either a speculative asset or a hedge against inflation and recession. Despite hopes that crypto could act as a risk hedge, the recent crash suggests it remains a speculative investment.
Since the downturn, the crypto market has seen its largest three-day sell-off in nearly a year, losing over $500 billion in market value. According to CoinGlass data, this bloodbath wiped out more than $1 billion in leveraged positions within the last 24 hours, including $365 million in Bitcoin and $348 million in Ether.
Khushboo Khullar of Lightning Ventures, speaking to Bloomberg, argued that the crypto sell-off is part of a broader liquidity panic as traders rush to cover margin calls. Khullar views this as a temporary sell-off, presenting a potential buying opportunity.
Josh Gilbert, an eToro market analyst, supports Khullar’s perspective, suggesting that the expected Federal Reserve rate cuts could benefit crypto assets. “Crypto assets have sold off, but many investors will see an opportunity. We see Federal Reserve rate cuts, which are now likely to come sharper than expected, as hugely positive for crypto assets,” Gilbert told Coindesk.
Despite the recent volatility, crypto continues to make strides toward mainstream acceptance. Notably, Morgan Stanley will allow its advisors to offer Bitcoin ETFs starting Wednesday. This follows more than half a year after the introduction of the first Bitcoin ETF. The investment bank will enable over 15,000 of its financial advisors to sell BlackRock’s IBIT and Fidelity’s FBTC. This move is seen as a significant step toward the “mainstreamization” of crypto, given the lengthy regulatory and company processes in major investment banks.
The recent crypto market downturn highlights its volatility and the broader economic concerns affecting all risk assets. While some analysts see the current situation as a temporary sell-off and a buying opportunity, others caution against the speculative nature of crypto. As the market evolves, its role as a mainstream alternative asset continues to grow, marked by increasing institutional acceptance and new investment opportunities.