Exchange-traded fund providers have flooded the market with all sorts of novel assets and strategies: single-stock ETFs, leveraged and inverse ETFs, and even spot bitcoin ETFs can be accessed through your brokerage account with the click of a mouse.
You don’t need any of it. Basic stocks and bonds are still the workhorses of real long-term investments, and access to them through tax-efficient ETFs has never been easier or cheaper.
Combining them in the right proportions can be another sticking point. Complex mathematical models that solve for an “optimal” portfolio look like one remedy. But they can create a false sense of security because the future is so difficult to predict with any degree of accuracy.
These complex tools still provide some insight. They demonstrate some simple and timeless principles that every investor should understand. Portfolio construction ultimately rests on a few basic ideas that have withstood the test of time. Investors need to incur enough risk to achieve a rate of return that will allow them to meet their goals. And they have two asset classes to help dial in the right amount of risk and return: high-risk stocks and low-risk bonds.
Smart People
Portfolio construction is ultimately about combining different assets to achieve a desired rate of return, level of risk, or both. In its ideal form, it tries to minimize the amount of risk necessary to achieve a desired rate of return or maximize the amount of return for a given level of risk.
Diversification plays a big role in achieving that objective. Diversifying a portfolio means holding multiple assets that perform in unrelated ways so that one won’t wipe out the entire portfolio when it goes through a rough patch. The trick lies in figuring out how much of each asset is necessary to realize the greatest benefit.
Harry Markowitz, the late Nobel Prize-winning economist, is credited with formalizing the mathematics behind portfolio construction. His model, still used by many financial professionals, calculates the precise weighting of stocks and bonds necessary to achieve an ideal portfolio—one that maximizes the rate of return for a given level of risk.
The math behind Markowitz’s framework is complicated—too complicated for most to comprehend. But it’s built on some simple concepts that can help any investor make better long-term investment decisions.
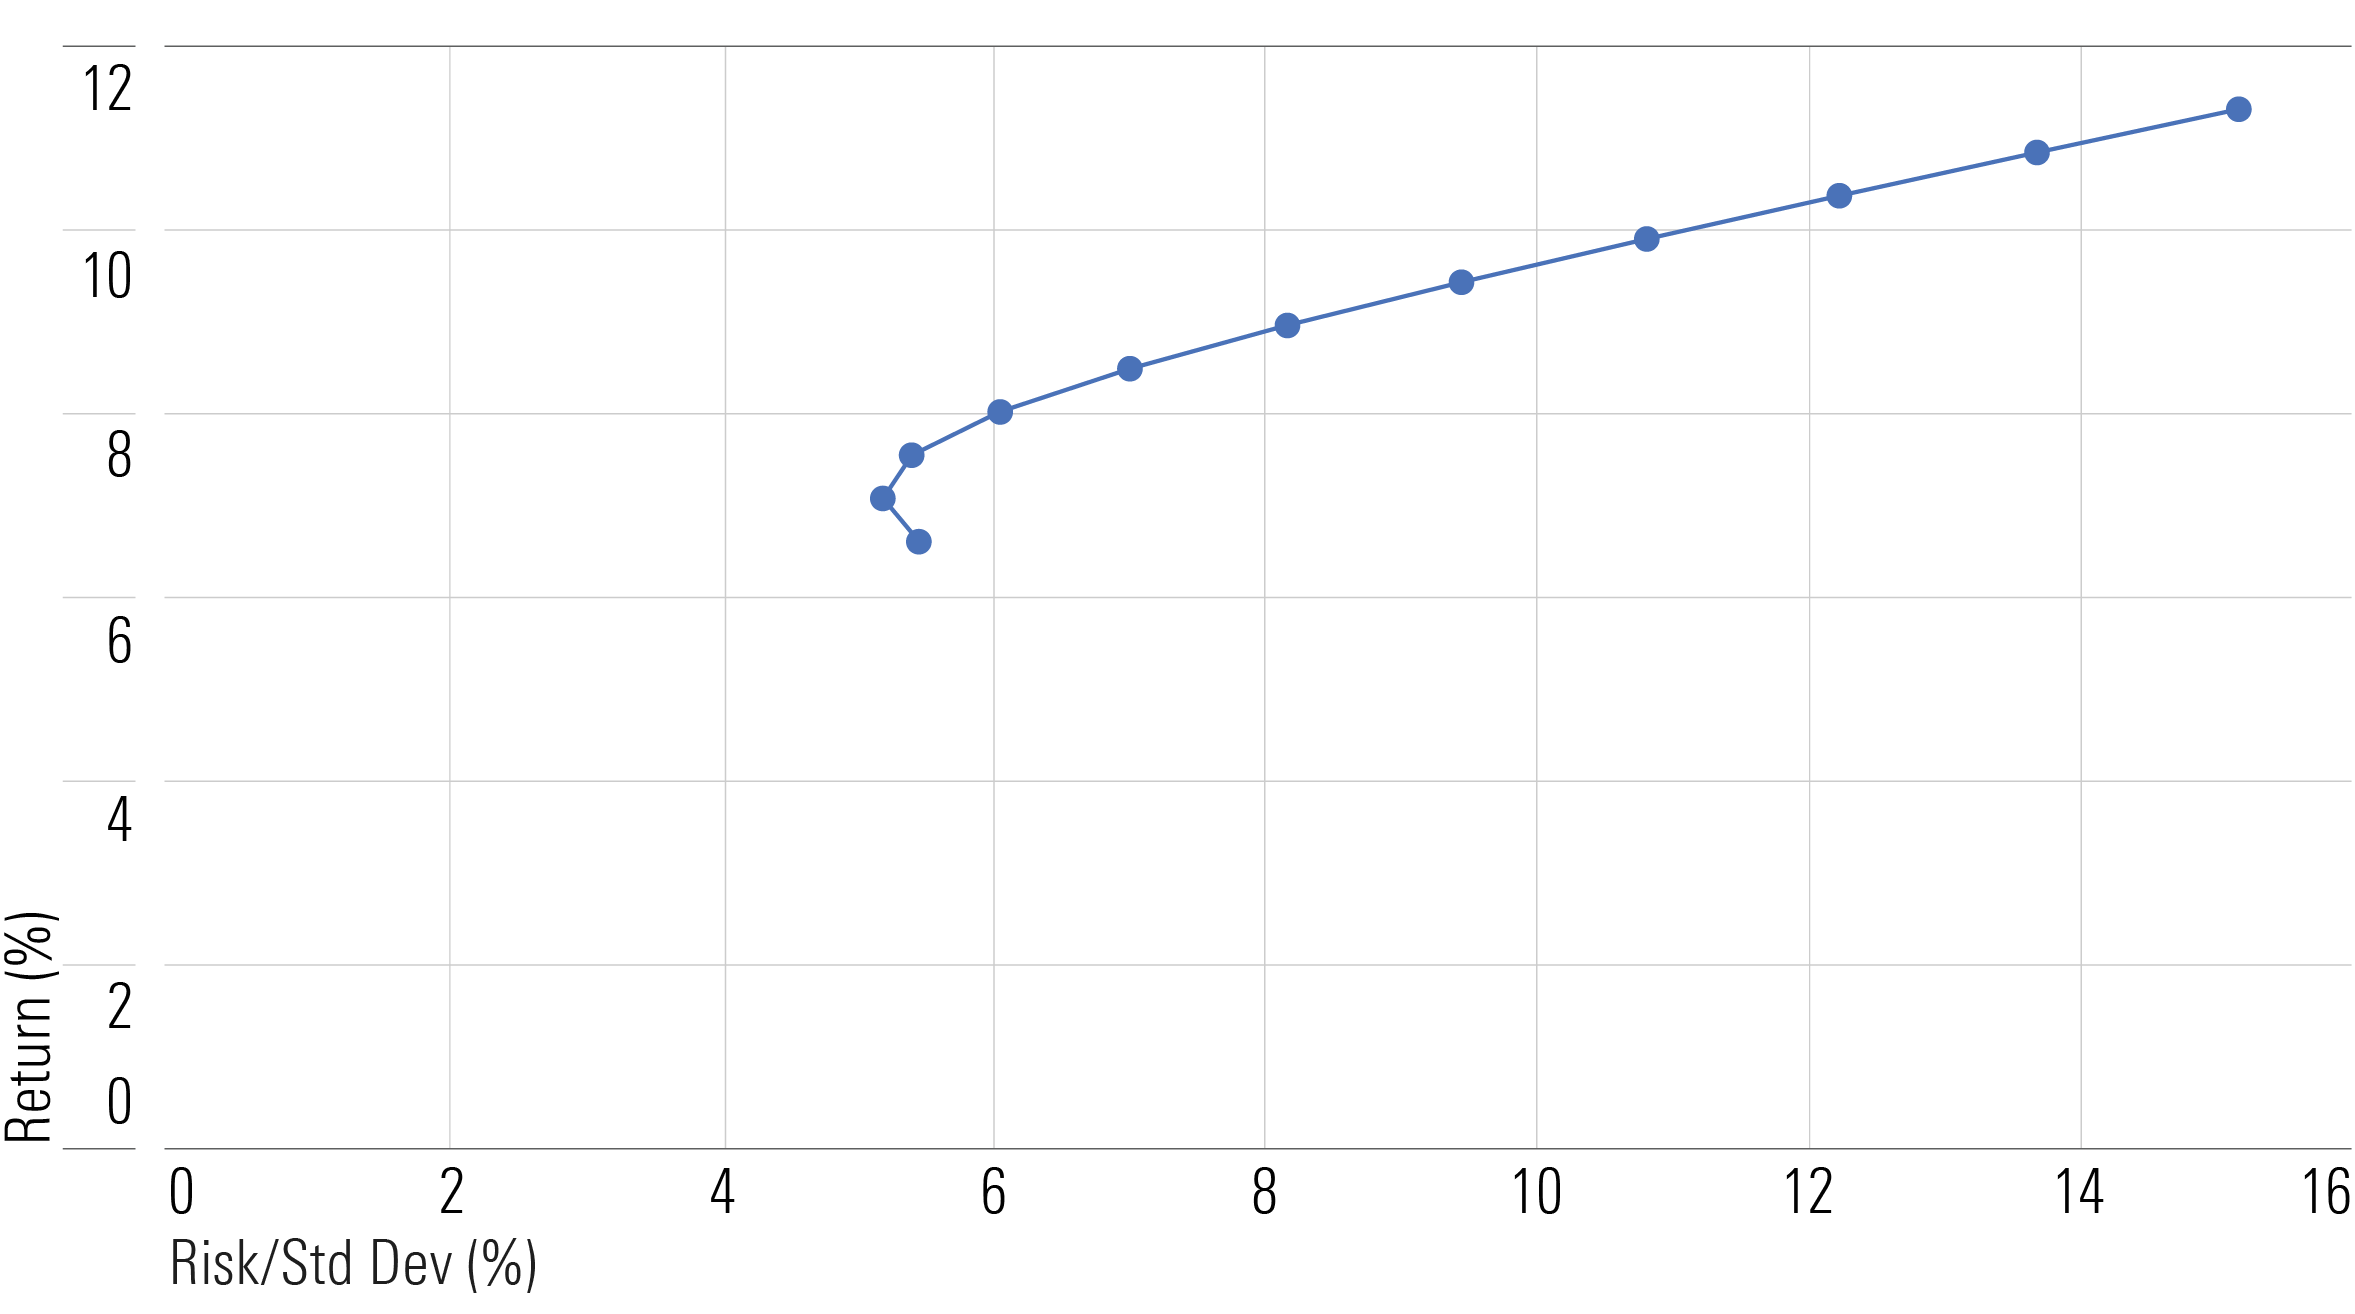
Exhibit 1 illustrates the output of Markowitz’s model, a chart commonly referred to as an “efficient frontier.” The plot shows various mixes of US stocks and bonds that produced the highest level of return (the vertical axis) for a given amount of risk (the horizontal axis). The point at the left end of the chart represents a low-risk portfolio of 100% investment-grade US bonds (proxied by the Bloomberg US Aggregate Bond Index), while the high-risk portfolio at the right end held only US stocks (proxied by the S&P 500). The points in between represent various mixes of those two assets.
Source: Morningstar Direct, author’s calculations. Data from January 1976 to October 2023.
There’s an easy conclusion to draw without reading too much into the numbers. Higher rates of return require taking on more risk. That means owning more stocks and fewer bonds. And there’s some nuance at the extreme ends of the chart. The least risky portfolio wasn’t the one fully allocated to bonds. It had a small investment in stocks, so the most risk-averse investor can further cut back on risk by owning some riskier equities. At the other end of the chart, the most aggressive investor can make a meaningful reduction in risk with only a modest hit to their long-term total return.
TORONTO – Canada’s main stock index was down more than 200 points in late-morning trading, weighed down by losses in the technology, base metal and energy sectors, while U.S. stock markets also fell.
The S&P/TSX composite index was down 239.24 points at 22,749.04.
In New York, the Dow Jones industrial average was down 312.36 points at 40,443.39. The S&P 500 index was down 80.94 points at 5,422.47, while the Nasdaq composite was down 380.17 points at 16,747.49.
The Canadian dollar traded for 73.80 cents US compared with 74.00 cents US on Thursday.
The October crude oil contract was down US$1.07 at US$68.08 per barrel and the October natural gas contract was up less than a penny at US$2.26 per mmBTU.
The December gold contract was down US$2.10 at US$2,541.00 an ounce and the December copper contract was down four cents at US$4.10 a pound.
This report by The Canadian Press was first published Sept. 6, 2024.
TORONTO – Canada’s main stock index was up more than 150 points in late-morning trading, helped by strength in technology, financial and energy stocks, while U.S. stock markets also pushed higher.
The S&P/TSX composite index was up 171.41 points at 23,298.39.
In New York, the Dow Jones industrial average was up 278.37 points at 41,369.79. The S&P 500 index was up 38.17 points at 5,630.35, while the Nasdaq composite was up 177.15 points at 17,733.18.
The Canadian dollar traded for 74.19 cents US compared with 74.23 cents US on Wednesday.
The October crude oil contract was up US$1.75 at US$76.27 per barrel and the October natural gas contract was up less than a penny at US$2.10 per mmBTU.
The December gold contract was up US$18.70 at US$2,556.50 an ounce and the December copper contract was down less than a penny at US$4.22 a pound.
This report by The Canadian Press was first published Aug. 29, 2024.
The crypto market has recently experienced a significant downturn, mirroring broader risk asset sell-offs. Over the past week, Bitcoin’s price dropped by 24%, reaching $53,000, while Ethereum plummeted nearly a third to $2,340. Major altcoins also suffered, with Cardano down 27.7%, Solana 36.2%, Dogecoin 34.6%, XRP 23.1%, Shiba Inu 30.1%, and BNB 25.7%.
The severe downturn in the crypto market appears to be part of a broader flight to safety, triggered by disappointing economic data. A worse-than-expected unemployment report on Friday marked the beginning of a technical recession, as defined by the Sahm Rule. This rule identifies a recession when the three-month average unemployment rate rises by at least half a percentage point from its lowest point in the past year.
Friday’s figures met this threshold, signaling an abrupt economic downshift. Consequently, investors sought safer assets, leading to declines in major stock indices: the S&P 500 dropped 2%, the Nasdaq 2.5%, and the Dow 1.5%. This trend continued into Monday with further sell-offs overseas.
The crypto market’s rapid decline raises questions about its role as either a speculative asset or a hedge against inflation and recession. Despite hopes that crypto could act as a risk hedge, the recent crash suggests it remains a speculative investment.
Since the downturn, the crypto market has seen its largest three-day sell-off in nearly a year, losing over $500 billion in market value. According to CoinGlass data, this bloodbath wiped out more than $1 billion in leveraged positions within the last 24 hours, including $365 million in Bitcoin and $348 million in Ether.
Khushboo Khullar of Lightning Ventures, speaking to Bloomberg, argued that the crypto sell-off is part of a broader liquidity panic as traders rush to cover margin calls. Khullar views this as a temporary sell-off, presenting a potential buying opportunity.
Josh Gilbert, an eToro market analyst, supports Khullar’s perspective, suggesting that the expected Federal Reserve rate cuts could benefit crypto assets. “Crypto assets have sold off, but many investors will see an opportunity. We see Federal Reserve rate cuts, which are now likely to come sharper than expected, as hugely positive for crypto assets,” Gilbert told Coindesk.
Despite the recent volatility, crypto continues to make strides toward mainstream acceptance. Notably, Morgan Stanley will allow its advisors to offer Bitcoin ETFs starting Wednesday. This follows more than half a year after the introduction of the first Bitcoin ETF. The investment bank will enable over 15,000 of its financial advisors to sell BlackRock’s IBIT and Fidelity’s FBTC. This move is seen as a significant step toward the “mainstreamization” of crypto, given the lengthy regulatory and company processes in major investment banks.
The recent crypto market downturn highlights its volatility and the broader economic concerns affecting all risk assets. While some analysts see the current situation as a temporary sell-off and a buying opportunity, others caution against the speculative nature of crypto. As the market evolves, its role as a mainstream alternative asset continues to grow, marked by increasing institutional acceptance and new investment opportunities.