TradingView has become one of the most popular trading platforms in the world over the past few years. It offers a wide range of tools, graphs, charts, and a bustling community that helps traders grow and become better at trading.
TradingView is especially useful for forex traders. It has everything you need all on one platform, from a watchlist that allows you to keep an eye on all your currency pairs to a news page that keeps you on top of current affairs that could affect your investments.
Interface
The most appealing aspect of TradingView is how clean and concise its interface is. Everything you need is easy to find; the tools are straightforward to understand and implement, and your charts and graphs can be as simple or as detailed as you choose.
The TradingView mobile app is also very user-friendly and just as easy to navigate, allowing you to stay on top of your trades no matter where you are.
Watchlist
The first big plus when using TradingView is their watchlist feature. Considering forex trading requires time to analyze markets and knowing when and what to trade, being able to see all the pairs you’re interested in on one page makes this so simple.
You are also able to label and colour different pairs, allowing you to mark them as a scalp trade, day trade, or something you want to watch in the future. This control means you won’t miss out on a change that could make or cost you money.
News
Global events, governmental decisions, and natural disasters are only a few things that can affect a currency’s power. There is no telling which event could impact our trades; therefore, you need to know what is happening at all times.
TradingView has a page that provides new headlines and updates for your currency pairs. Not only do you keep up to date with world events, but you also barely have to search for the headlines and stories that are relevant to you.
Charts
This is where TradingView shines. The platform offers numerous tools and charts that allow you to track your investments, trading pairs, and potential trading pairs. You are able to track and mark patterns, as well as compare movements to previous time periods.
You can add numerous indicators as well, ranging from volatility to a price spike or fall and dozens of others. These indicators allow you to see large amounts of information at a glance, all on one or two graphs.
Alerts
There is no point in having all of this information at our fingertips if you have to log in and find it all out every time. TradingView has multiple alert types available as well, from volatility alerts, news alerts, percentage changes, etc.
You can also have timed alerts, allowing you to have an online diary of sorts. You can decide if you want the alert to be sent via SMS or email, and doing this every day ensures you don’t miss a thing.
Screener
TradingView offers three different kinds of screeners, one for cryptos, one for stocks, and one for forex. The screeners allow traders to see all the essential information about their chosen currency pairs at a glance.
Like stock and crypto websites with pages and pages of options and their position changes, the screener tool allows you to streamline this and only show the information you want to and need to see.
Sharing Trade Ideas
One of the unique aspects of TradingView that is nothing less than great is its social media platform. Not only is there an active forum that allows you to connect and chat with other traders, but you can also share trading tips and ideas.
The site allows users to make a “trading/tip post,” where you can name and provide details about the tip or the strategy you will use for a particular trade. You can then save and share these ideas on the platform.
Other traders are then able to follow your post and comment on it. These types of tips are surprisingly useful for traders who want to work in the industry, as it is a breadcrumb trail that proves your prediction abilities and trading strengths.
TORONTO – Canada’s main stock index was up more than 100 points in late-morning trading, helped by strength in base metal and utility stocks, while U.S. stock markets were mixed.
The S&P/TSX composite index was up 103.40 points at 24,542.48.
In New York, the Dow Jones industrial average was up 192.31 points at 42,932.73. The S&P 500 index was up 7.14 points at 5,822.40, while the Nasdaq composite was down 9.03 points at 18,306.56.
The Canadian dollar traded for 72.61 cents US compared with 72.44 cents US on Tuesday.
The November crude oil contract was down 71 cents at US$69.87 per barrel and the November natural gas contract was down eight cents at US$2.42 per mmBTU.
The December gold contract was up US$7.20 at US$2,686.10 an ounce and the December copper contract was up a penny at US$4.35 a pound.
This report by The Canadian Press was first published Oct. 16, 2024.
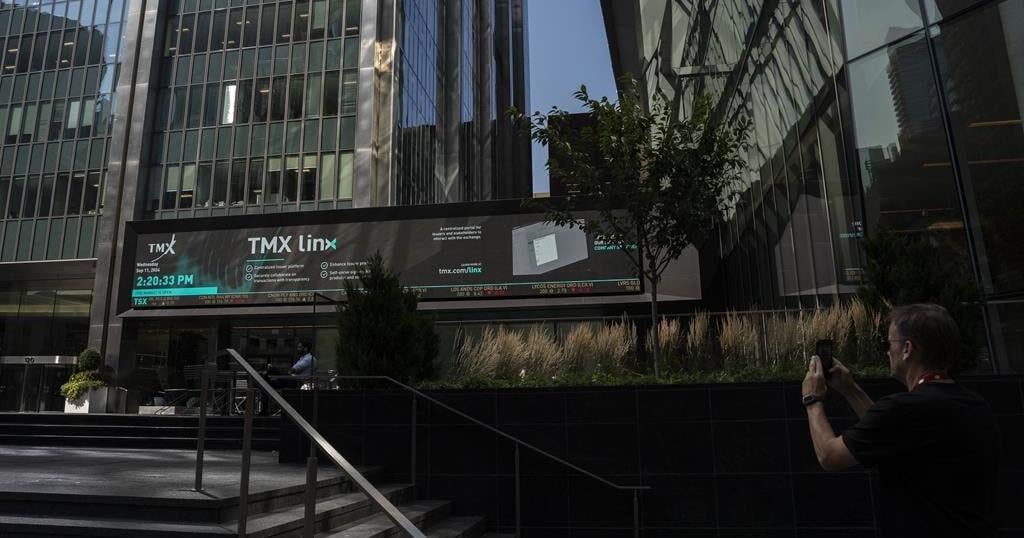
TORONTO – Canada’s main stock index was up more than 200 points in late-morning trading, while U.S. stock markets were also headed higher.
The S&P/TSX composite index was up 205.86 points at 24,508.12.
In New York, the Dow Jones industrial average was up 336.62 points at 42,790.74. The S&P 500 index was up 34.19 points at 5,814.24, while the Nasdaq composite was up 60.27 points at 18.342.32.
The Canadian dollar traded for 72.61 cents US compared with 72.71 cents US on Thursday.
The November crude oil contract was down 15 cents at US$75.70 per barrel and the November natural gas contract was down two cents at US$2.65 per mmBTU.
The December gold contract was down US$29.60 at US$2,668.90 an ounce and the December copper contract was up four cents at US$4.47 a pound.
This report by The Canadian Press was first published Oct. 11, 2024.
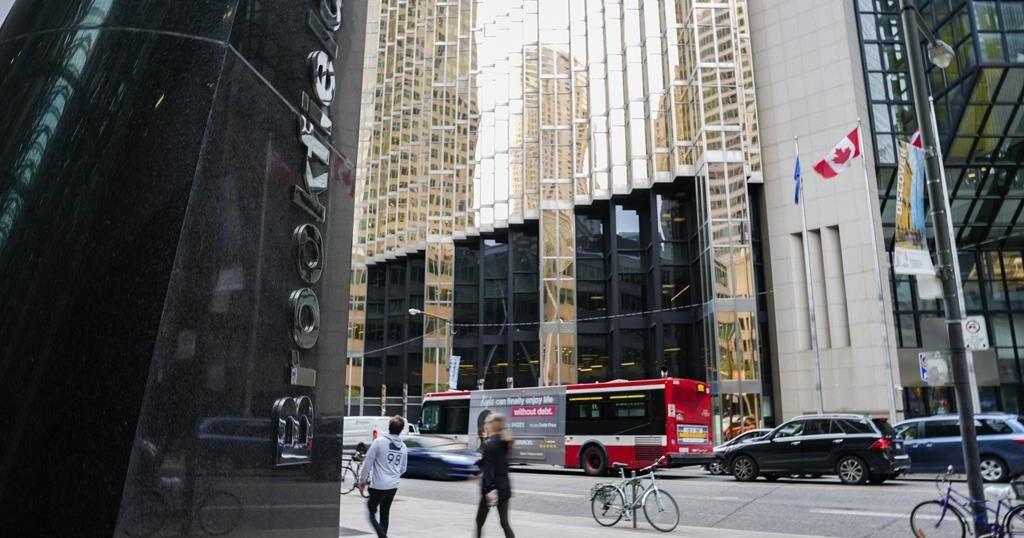
TORONTO – Canada’s main stock index was little changed in late-morning trading as the financial sector fell, but energy and base metal stocks moved higher.
The S&P/TSX composite index was up 0.05 of a point at 24,224.95.
In New York, the Dow Jones industrial average was down 94.31 points at 42,417.69. The S&P 500 index was down 10.91 points at 5,781.13, while the Nasdaq composite was down 29.59 points at 18,262.03.
The Canadian dollar traded for 72.71 cents US compared with 73.05 cents US on Wednesday.
The November crude oil contract was up US$1.69 at US$74.93 per barrel and the November natural gas contract was up a penny at US$2.67 per mmBTU.
The December gold contract was up US$14.70 at US$2,640.70 an ounce and the December copper contract was up two cents at US$4.42 a pound.
This report by The Canadian Press was first published Oct. 10, 2024.