Investing 100% of Your Portfolio in Stocks - A Wealth of Common Sense | Canada News Media
Connect with us

Investment

Investing 100% of Your Portfolio in Stocks – A Wealth of Common Sense

Published

 on

A reader asks:

I am a 34-year-old with a high risk tolerance. All of my investment accounts are 100% invested in stocks. The one thing I have a hard time finding a tried and true answer on when I do research is how to best allocate my stock investments among large-cap, mid-cap, international, emerging markets, etc. I’m not looking to get the highest return possible per se (although that would be nice), rather, I am looking to have a well-diversified portfolio that gives me exposure to the various aspects of the stock market so that my long-term return is 7%-10%. I have always utilized the following allocation for no other reason than it seems reasonable and is well diversified:  

    • 33% U.S. large cap
    • 17% U.S. mid cap
    • 16% U.S. small cap
    • 20% developed international
    • 14% emerging markets

Does this seem about right to you? Would love to know how you think about your stock allocation and what you utilize as a good benchmark.

I can’t promise anything when it comes to future returns for the stock market but a global benchmark for the stock market is fairly straightforward.

The world stock market is a good starting point to compare your 100% stock portfolio to because that’s the investable universe.

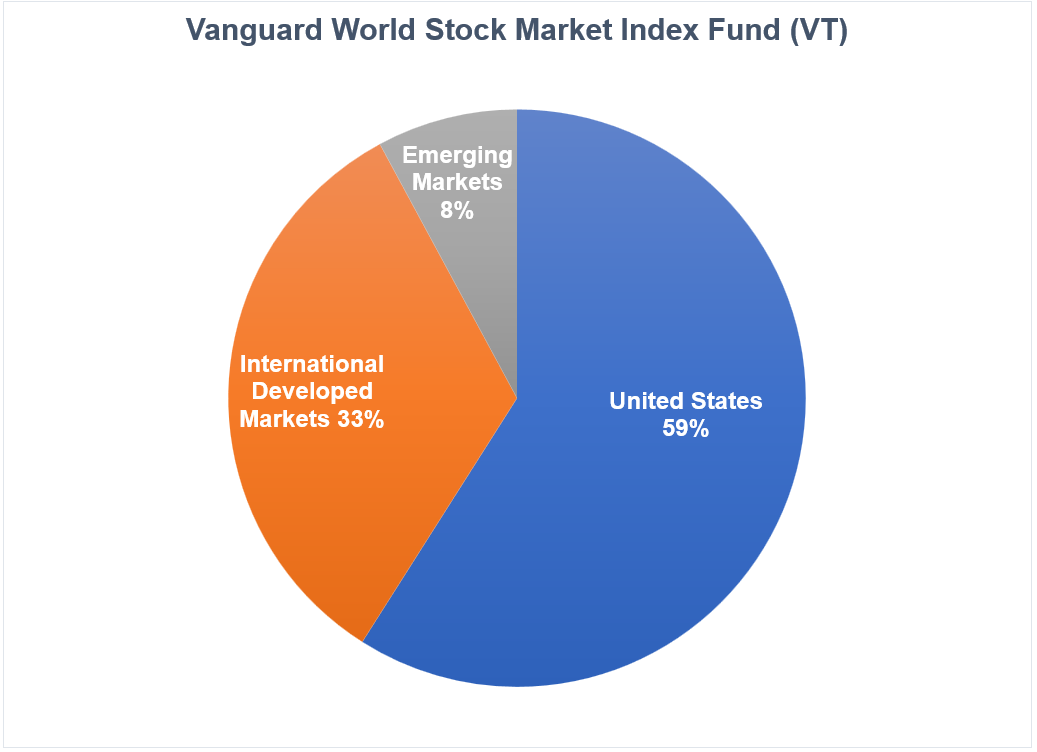
Here’s the current breakdown based on the Vanguard World Stock Market ETF (VT):

That’s nearly 60% in U.S. stocks, one-third in foreign developed stocks and just under 10% in emerging markets.

This is market cap breakdown on a global basis:

The large, mid and small weightings globally are basically the same as they are in the United States:

I’m not saying you have to follow global weightings (actually the portfolio in question is pretty close). I just think the global market cap is a good jumping-off point to see where you differ from the actual market.

If nothing else, you can use the world stock market as a benchmark for performance attribution and understand where your bets are being made.

Many investors probably assume the S&P 500 or a total U.S. stock market index fund should be the benchmark of choice. With the United States making up 60% of the total pie and getting all of the publicity when it comes to the financial media, I understand why this would be the case.

In fact, out of the top 25 holdings for the Vanguard World Stock Market Index Fund, just 4 are foreign companies:

America dominates the stock market.

I do, however, still think there is room for diversification if you’re going to invest your entire portfolio in stocks.

I know it seems like the S&P 500 always outperforms small caps, mid caps, international developed markets and emerging markets but you don’t have to go back that far to find a time when the biggest companies in America underperformed.

There are the total returns1 in the first decade of the 21st century:

It was a lost decade for the S&P 500. And diversification saved the day if you spread your bets among these other areas of the market.

Now here’s what happened in the ensuing decade:

The S&P 500 came back with a vengeance while emerging markets went from first place to last place.

Now here’s what it looks like if we put it all together for both decades:

Surprisingly, the S&P 500 ranks second to last in terms of total performance from 2000-2019.

Some of this has to do with the start and end dates chosen here. The year 2000 was likely the worst entry point in modern U.S. stock market history.2 I could change the start date and the S&P would look at lot better than this.

But maybe that’s my point.

You just never know when certain markets, geographies, market caps or risk factors are going to knock the cover off the ball or strike out.

That’s why I think diversification is important, even if you plan on investing 100% of your money in the stock market.

We talked about this question on this week’s Ask the Compound:

Doug Boneparth joined me on the show this week to discuss questions about managing your finances in middle age, budgeting for RSUs, financial planning for families and how to allocate between investments and cash.

1Here’s what I used for each asset class here: S&P 500, S&P 600, S&P 400, MSCI EAFE and MSCI EM.

2September 1929 wasn’t great either.


Source link

Continue Reading

Economy

S&P/TSX gains almost 100 points, U.S. markets also higher ahead of rate decision

Published

 on


TORONTO – Strength in the base metal and technology sectors helped Canada’s main stock index gain almost 100 points on Friday, while U.S. stock markets climbed to their best week of the year.

“It’s been almost a complete opposite or retracement of what we saw last week,” said Philip Petursson, chief investment strategist at IG Wealth Management.

In New York, the Dow Jones industrial average was up 297.01 points at 41,393.78. The S&P 500 index was up 30.26 points at 5,626.02, while the Nasdaq composite was up 114.30 points at 17,683.98.

The S&P/TSX composite index closed up 93.51 points at 23,568.65.

While last week saw a “healthy” pullback on weaker economic data, this week investors appeared to be buying the dip and hoping the central bank “comes to the rescue,” said Petursson.

Next week, the U.S. Federal Reserve is widely expected to cut its key interest rate for the first time in several years after it significantly hiked it to fight inflation.

But the magnitude of that first cut has been the subject of debate, and the market appears split on whether the cut will be a quarter of a percentage point or a larger half-point reduction.

Petursson thinks it’s clear the smaller cut is coming. Economic data recently hasn’t been great, but it hasn’t been that bad either, he said — and inflation may have come down significantly, but it’s not defeated just yet.

“I think they’re going to be very steady,” he said, with one small cut at each of their three decisions scheduled for the rest of 2024, and more into 2025.

“I don’t think there’s a sense of urgency on the part of the Fed that they have to do something immediately.

A larger cut could also send the wrong message to the markets, added Petursson: that the Fed made a mistake in waiting this long to cut, or that it’s seeing concerning signs in the economy.

It would also be “counter to what they’ve signaled,” he said.

More important than the cut — other than the new tone it sets — will be what Fed chair Jerome Powell has to say, according to Petursson.

“That’s going to be more important than the size of the cut itself,” he said.

In Canada, where the central bank has already cut three times, Petursson expects two more before the year is through.

“Here, the labour situation is worse than what we see in the United States,” he said.

The Canadian dollar traded for 73.61 cents US compared with 73.58 cents US on Thursday.

The October crude oil contract was down 32 cents at US$68.65 per barrel and the October natural gas contract was down five cents at US$2.31 per mmBTU.

The December gold contract was up US$30.10 at US$2,610.70 an ounce and the December copper contract was up four cents US$4.24 a pound.

— With files from The Associated Press

This report by The Canadian Press was first published Sept. 13, 2024.

Companies in this story: (TSX:GSPTSE, TSX:CADUSD)

The Canadian Press. All rights reserved.

Source link

Continue Reading

Economy

S&P/TSX composite down more than 200 points, U.S. stock markets also fall

Published

 on


TORONTO – Canada’s main stock index was down more than 200 points in late-morning trading, weighed down by losses in the technology, base metal and energy sectors, while U.S. stock markets also fell.

The S&P/TSX composite index was down 239.24 points at 22,749.04.

In New York, the Dow Jones industrial average was down 312.36 points at 40,443.39. The S&P 500 index was down 80.94 points at 5,422.47, while the Nasdaq composite was down 380.17 points at 16,747.49.

The Canadian dollar traded for 73.80 cents US compared with 74.00 cents US on Thursday.

The October crude oil contract was down US$1.07 at US$68.08 per barrel and the October natural gas contract was up less than a penny at US$2.26 per mmBTU.

The December gold contract was down US$2.10 at US$2,541.00 an ounce and the December copper contract was down four cents at US$4.10 a pound.

This report by The Canadian Press was first published Sept. 6, 2024.

Companies in this story: (TSX:GSPTSE, TSX:CADUSD)

The Canadian Press. All rights reserved.

Source link

Continue Reading

Economy

S&P/TSX composite up more than 150 points, U.S. stock markets also higher

Published

 on


TORONTO – Canada’s main stock index was up more than 150 points in late-morning trading, helped by strength in technology, financial and energy stocks, while U.S. stock markets also pushed higher.

The S&P/TSX composite index was up 171.41 points at 23,298.39.

In New York, the Dow Jones industrial average was up 278.37 points at 41,369.79. The S&P 500 index was up 38.17 points at 5,630.35, while the Nasdaq composite was up 177.15 points at 17,733.18.

The Canadian dollar traded for 74.19 cents US compared with 74.23 cents US on Wednesday.

The October crude oil contract was up US$1.75 at US$76.27 per barrel and the October natural gas contract was up less than a penny at US$2.10 per mmBTU.

The December gold contract was up US$18.70 at US$2,556.50 an ounce and the December copper contract was down less than a penny at US$4.22 a pound.

This report by The Canadian Press was first published Aug. 29, 2024.

Companies in this story: (TSX:GSPTSE, TSX:CADUSD)

The Canadian Press. All rights reserved.

Source link

Continue Reading

Trending

Exit mobile version