Legendary fund manager Li Lu (who Charlie Munger backed) once said, ‘The biggest investment risk is not the volatility of prices, but whether you will suffer a permanent loss of capital. It’s only natural to consider a company’s balance sheet when you examine how risky it is, since debt is often involved when a business collapses. As with many other companies Avidly Oyj (HEL:AVIDLY) makes use of debt. But is this debt a concern to shareholders?
When Is Debt A Problem?
Debt is a tool to help businesses grow, but if a business is incapable of paying off its lenders, then it exists at their mercy. Ultimately, if the company can’t fulfill its legal obligations to repay debt, shareholders could walk away with nothing. However, a more frequent (but still costly) occurrence is where a company must issue shares at bargain-basement prices, permanently diluting shareholders, just to shore up its balance sheet. Having said that, the most common situation is where a company manages its debt reasonably well – and to its own advantage. When we examine debt levels, we first consider both cash and debt levels, together.
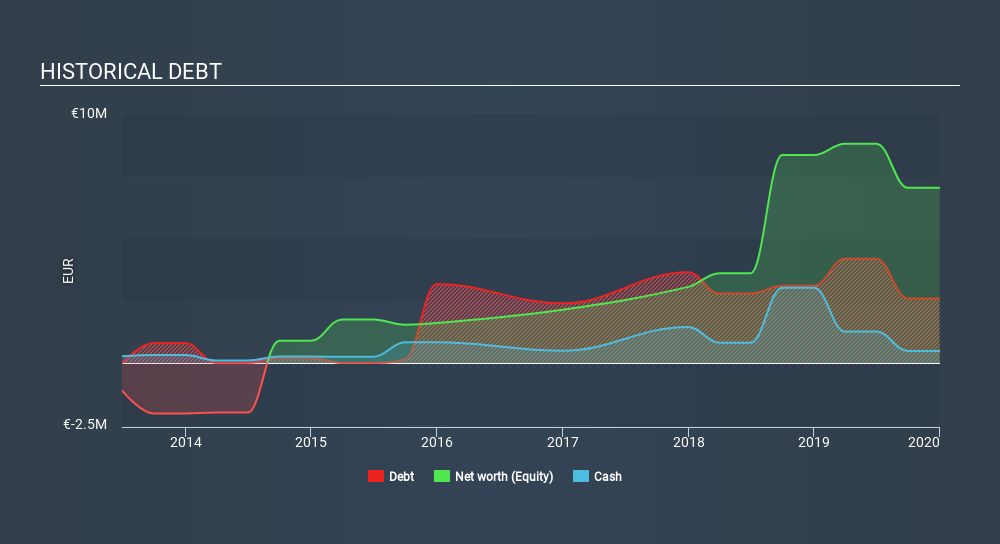
As you can see below, Avidly Oyj had €2.59m of debt at December 2019, down from €3.10m a year prior. However, it also had €484.0k in cash, and so its net debt is €2.11m.
HLSE:AVIDLY Historical Debt May 3rd 2020
How Healthy Is Avidly Oyj’s Balance Sheet?
According to the last reported balance sheet, Avidly Oyj had liabilities of €7.69m due within 12 months, and liabilities of €3.53m due beyond 12 months. Offsetting these obligations, it had cash of €484.0k as well as receivables valued at €3.54m due within 12 months. So it has liabilities totalling €7.20m more than its cash and near-term receivables, combined.
This deficit casts a shadow over the €4.45m company, like a colossus towering over mere mortals. So we’d watch its balance sheet closely, without a doubt. After all, Avidly Oyj would likely require a major re-capitalisation if it had to pay its creditors today. There’s no doubt that we learn most about debt from the balance sheet. But it is future earnings, more than anything, that will determine Avidly Oyj’s ability to maintain a healthy balance sheet going forward. So if you’re focused on the future you can check out this freereport showing analyst profit forecasts.
Over 12 months, Avidly Oyj reported revenue of €22m, which is a gain of 12%, although it did not report any earnings before interest and tax. We usually like to see faster growth from unprofitable companies, but each to their own.
Caveat Emptor
Over the last twelve months Avidly Oyj produced an earnings before interest and tax (EBIT) loss. Indeed, it lost a very considerable €2.2m at the EBIT level. Considering that alongside the liabilities mentioned above make us nervous about the company. We’d want to see some strong near-term improvements before getting too interested in the stock. Not least because it had negative free cash flow of €1.4m over the last twelve months. So suffice it to say we consider the stock to be risky. When analysing debt levels, the balance sheet is the obvious place to start. However, not all investment risk resides within the balance sheet – far from it. For example, we’ve discovered 3 warning signs for Avidly Oyj (2 are potentially serious!) that you should be aware of before investing here.
If you spot an error that warrants correction, please contact the editor at editorial-team@simplywallst.com. This article by Simply Wall St is general in nature. It does not constitute a recommendation to buy or sell any stock, and does not take account of your objectives, or your financial situation. Simply Wall St has no position in the stocks mentioned.
We aim to bring you long-term focused research analysis driven by fundamental data. Note that our analysis may not factor in the latest price-sensitive company announcements or qualitative material. Thank you for reading.
The easiest way to discover new investment ideas
Save hours of research when discovering your next investment with Simply Wall St. Looking for companies potentially undervalued based on their future cash flows? Or maybe you’re looking for sustainable dividend payers or high growth potential stocks. Customise your search to easily find new investment opportunities that match your investment goals. And the best thing about it? It’s FREE. Click here to learn more.
TORONTO – Canada’s main stock index was up more than 100 points in late-morning trading, helped by strength in base metal and utility stocks, while U.S. stock markets were mixed.
The S&P/TSX composite index was up 103.40 points at 24,542.48.
In New York, the Dow Jones industrial average was up 192.31 points at 42,932.73. The S&P 500 index was up 7.14 points at 5,822.40, while the Nasdaq composite was down 9.03 points at 18,306.56.
The Canadian dollar traded for 72.61 cents US compared with 72.44 cents US on Tuesday.
The November crude oil contract was down 71 cents at US$69.87 per barrel and the November natural gas contract was down eight cents at US$2.42 per mmBTU.
The December gold contract was up US$7.20 at US$2,686.10 an ounce and the December copper contract was up a penny at US$4.35 a pound.
This report by The Canadian Press was first published Oct. 16, 2024.
TORONTO – Canada’s main stock index was up more than 200 points in late-morning trading, while U.S. stock markets were also headed higher.
The S&P/TSX composite index was up 205.86 points at 24,508.12.
In New York, the Dow Jones industrial average was up 336.62 points at 42,790.74. The S&P 500 index was up 34.19 points at 5,814.24, while the Nasdaq composite was up 60.27 points at 18.342.32.
The Canadian dollar traded for 72.61 cents US compared with 72.71 cents US on Thursday.
The November crude oil contract was down 15 cents at US$75.70 per barrel and the November natural gas contract was down two cents at US$2.65 per mmBTU.
The December gold contract was down US$29.60 at US$2,668.90 an ounce and the December copper contract was up four cents at US$4.47 a pound.
This report by The Canadian Press was first published Oct. 11, 2024.
TORONTO – Canada’s main stock index was little changed in late-morning trading as the financial sector fell, but energy and base metal stocks moved higher.
The S&P/TSX composite index was up 0.05 of a point at 24,224.95.
In New York, the Dow Jones industrial average was down 94.31 points at 42,417.69. The S&P 500 index was down 10.91 points at 5,781.13, while the Nasdaq composite was down 29.59 points at 18,262.03.
The Canadian dollar traded for 72.71 cents US compared with 73.05 cents US on Wednesday.
The November crude oil contract was up US$1.69 at US$74.93 per barrel and the November natural gas contract was up a penny at US$2.67 per mmBTU.
The December gold contract was up US$14.70 at US$2,640.70 an ounce and the December copper contract was up two cents at US$4.42 a pound.
This report by The Canadian Press was first published Oct. 10, 2024.