British Columbia voters face no shortage of policies when it comes to tackling the province’s housing woes in the run-up to Saturday’s election, with a clear choice for the next government’s approach.
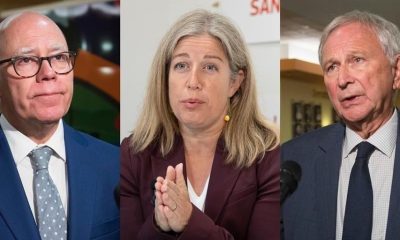
David Eby’s New Democrats say the housing market on its own will not deliver the homes people need, while B.C. Conservative Leader John Rustad saysgovernment is part of the problem and B.C. needs to “unleash” the potential of the private sector.
But Andy Yan, director of the City Program at Simon Fraser University, said the “punchline” was that neither would have a hand in regulating interest rates, the “giant X-factor” in housing affordability.
“The one policy that controls it all just happens to be a policy that the province, whoever wins, has absolutely no control over,” said Yan, who made a name for himself scrutinizing B.C.’s chronic affordability problems.
Some metrics have shown those problems easing, with Eby pointing to what he said was a seven per cent drop in rent prices in Vancouver.
But Statistics Canada says 2021 census data shows that 25.5 per cent of B.C. households were paying at least 30 per cent of their income on shelter costs, the worst for any province or territory.
Yan said government had “access to a few levers” aimed at boosting housing affordability, and Eby has been pulling several.
Yet a host of other factors are at play, rates in particular, Yan said.
“This is what makes housing so frustrating, right? It takes time. It takes decades through which solutions and policies play out,” Yan said.
Rustad, meanwhile, is running on a “deregulation” platform.
He has pledged to scrap key NDP housing initiatives, including the speculation and vacancy tax, restrictions on short-term rentals,and legislation aimed at boosting small-scale density in single-family neighbourhoods.
Green Leader Sonia Furstenau, meanwhile, says “commodification” of housing by large investors is a major factor driving up costs, and her party would prioritize people most vulnerable in the housing market.
Yan said it was too soon to fully assess the impact of the NDP government’s housing measures, but there was a risk housing challenges could get worse if certain safeguards were removed, such as policies that preserve existing rental homes.
If interest rates were to drop, spurring a surge of redevelopment, Yan said the new homes with higher rents could wipe the older, cheaper units off the map.
“There is this element of change and redevelopment that needs to occur as a city grows, yet the loss of that stock is part of really, the ongoing challenges,” Yan said.
Given the external forces buffeting the housing market, Yan said the question before voters this month was more about “narrative” than numbers.
“Who do you believe will deliver a better tomorrow?”
Yan said the market has limits, and governments play an important role in providing safeguards for those most vulnerable.
The market “won’t by itself deal with their housing needs,” Yan said, especially given what he described as B.C.’s “30-year deficit of non-market housing.”
IS HOUSING THE ‘GOVERNMENT’S JOB’?
Craig Jones, associate director of the Housing Research Collaborative at the University of British Columbia, echoed Yan, saying people are in “housing distress” and in urgent need of help in the form of social or non-market housing.
“The amount of housing that it’s going to take through straight-up supply to arrive at affordability, it’s more than the system can actually produce,” he said.
Among the three leaders, Yan said it was Furstenau who had focused on the role of the “financialization” of housing, or large investors using housing for profit.
“It really squeezes renters,” he said of the trend. “It captures those units that would ordinarily become affordable and moves (them) into an investment product.”
The Greens’ platform includes a pledge to advocate for federal legislation banning the sale of residential units toreal estate investment trusts, known as REITs.
The party has also proposed a two per cent tax on homes valued at $3 million or higher, while committing $1.5 billion to build 26,000 non-market units each year.
Eby’s NDP government has enacted a suite of policies aimed at speeding up the development and availability of middle-income housing and affordable rentals.
They include the Rental Protection Fund, which Jones described as a “cutting-edge” policy. The $500-million fund enables non-profit organizations to purchase and manage existing rental buildings with the goal of preserving their affordability.
Another flagship NDP housing initiative, dubbed BC Builds, uses $2 billion in government financingto offer low-interest loans for the development of rental buildings on low-cost, underutilized land. Under the program, operators must offer at least 20 per cent of their units at 20 per cent below the market value.
Ravi Kahlon, the NDP candidate for Delta North who serves as Eby’s housing minister,said BC Builds was designed to navigate “huge headwinds” in housing development, including high interest rates, global inflation and the cost of land.
Boosting supply is one piece of the larger housing puzzle, Kahlon said in an interview before the start of the election campaign.
“We also need governments to invest and … come up with innovative programs to be able to get more affordability than the market can deliver,” he said.
The NDP is also pledging to help more middle-class, first-time buyers into the housing market with a plan to finance 40 per cent of the price on certain projects, with the money repayable as a loan and carrying an interest rate of 1.5 per cent. The government’s contribution would have to be repaid upon resale, plus 40 per cent of any increase in value.
The Canadian Press reached out several times requesting a housing-focused interview with Rustad or another Conservative representative, but received no followup.
At a press conference officially launching the Conservatives’ campaign, Rustad said Eby “seems to think that (housing) is government’s job.”
A key element of the Conservatives’ housing plans is a provincial tax exemption dubbed the “Rustad Rebate.” It would start in 2026 with residents able to deduct up to $1,500 per month for rent and mortgage costs, increasing to $3,000 in 2029.
Rustad also wants Ottawa to reintroduce a 1970s federal program that offered tax incentives to spur multi-unit residential building construction.
“It’s critical to bring that back and get the rental stock that we need built,” Rustad said of the so-called MURB program during the recent televised leaders’ debate.
Rustad also wants to axe B.C.’s speculation and vacancy tax, which Eby says has added 20,000 units to the long-term rental market, and repeal rules restricting short-term rentals on platforms such as Airbnb and Vrbo to an operator’s principal residence or one secondary suite.
“(First) of all it was foreigners, and then it was speculators, and then it was vacant properties, and then it was Airbnbs, instead of pointing at the real problem, which is government, and government is getting in the way,” Rustad said during the televised leaders’ debate.
Rustad has also promised to speed up approvals for rezoning and development applications, and to step in if a city fails to meet the six-month target.
Eby’s approach to clearing zoning and regulatory hurdles includes legislation passed last fall that requires municipalities with more than 5,000 residents to allow small-scale, multi-unit housing on lots previously zoned for single family homes.
The New Democrats have also recently announced a series of free, standardized building designs and a plan to fast-track prefabricated homes in the province.
A statement from B.C.’s Housing Ministry said more than 90 per cent of 188 local governments had adopted the New Democrats’ small-scale, multi-unit housing legislation as of last month, while 21 had received extensions allowing more time.
Rustad has pledged to repeal that law too, describing Eby’s approach as “authoritarian.”
The Greens are meanwhile pledging to spend $650 million in annual infrastructure funding for communities, increase subsidies for elderly renters, and bring in vacancy control measures to prevent landlords from drastically raising rents for new tenants.
Yan likened the Oct. 19 election to a “referendum about the course that David Eby has set” for housing, with Rustad “offering a completely different direction.”
Regardless of which party and leader emerges victorious, Yan said B.C.’s next government will be working against the clock, as well as cost pressures.
Yan said failing to deliver affordable homes for everyone, particularly people living on B.C. streets and young, working families, came at a cost to the whole province.
“It diminishes us as a society, but then also as an economy.”
This report by The Canadian Press was first published Oct. 17, 2024.