A man in a Santa Clause costume gestures on the floor at the closing bell of the Dow Industrial … [+] Average at the New York Stock Exchange on December 5, 2019 in New York. – Wall Street stocks finished slightly higher following a choppy session that avoided the big swings from earlier in the week on trade-oriented headlines. US and Chinese negotiators are working to finalize a preliminary trade deal announced in October that would block new tariffs expected to take effect this month. Officials have sent mixed signals on the talks, sending shares gyrating. (Photo by Bryan R. Smith / AFP) (Photo by BRYAN R. SMITH/AFP via Getty Images)
AFP via Getty Images
The employment data for November were downbeat, and those surveys were taken prior to many newly imposed restrictions including stay-at-home orders.
Other economic data, including Black Friday-Cyber Monday spending, and manufacturing and service indexes also disappointed. Pessimism also showed up in the Fed’s recent Beige Book, its survey of business sentiment.
Yet, despite all the downbeat economic news and forecasts, equity markets set new all-time highs the week ended December 4th. They are marching to a drummer that has little to do with underlying economics.
A No-Grinch Season Despite COVID
We took our nearly three-year-old granddaughter on a car ride through the residential areas to see Christmas light displays on local homes. At nearly three, this is the first year of some understanding of the concept of Santa, and anticipation of the arrival of Christmas Day. And, we weren’t disappointed; in fact, quite impressed. Despite stay-at-home orders, business restrictions, and worry about the pandemic, or perhaps because of it, people have put great effort into decorating their homes for the season. I can’t remember seeing so many homes decorated so lavishly. No COVID-Grinch is going to steal this season!
Similarly, despite what could turn out to be a double-dip recession in the economy, equity markets are having none of it.
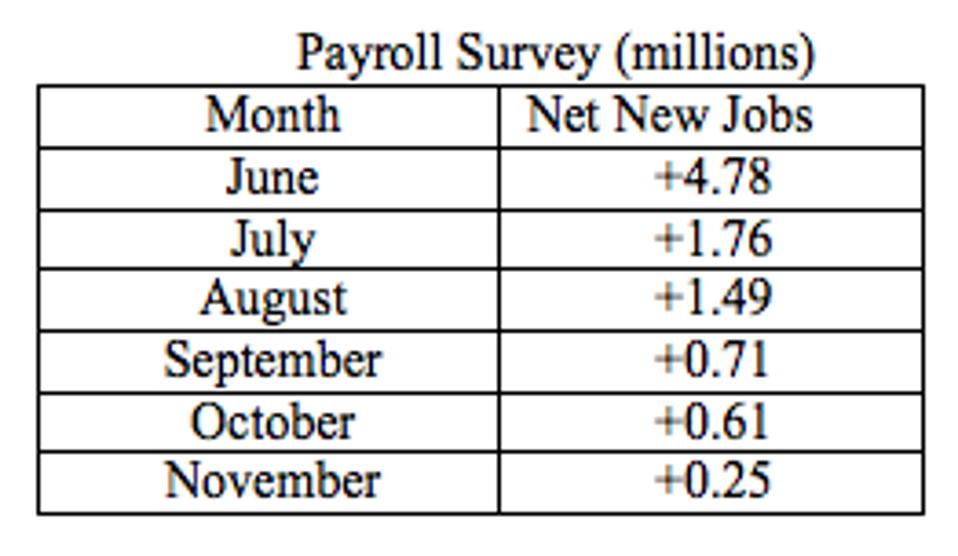
The big story for the week was in the labor market data. The headline Establishment (Payroll) Survey only rose +245K; the consensus was for a rise of more than 440K. The table shows the clear decelerating trend in this indicator since June:
I have been writing about the coming labor market slowdown since the surge in the virus caused renewed business restrictions. We are now seeing this play out. Likely the downtrend has more legs, as many more business restraints have been promulgated since the employment survey period (November 9th to 13th).
The sister Household Survey, from which the unemployment rates are calculated, showed that net new jobs fell -74K for the November survey period (nary a report of this in the business media). True, the unemployment rate (U3) fell, as per consensus, from 6.9% to 6.7%, but that was perversely due to a shrinkage of -400K in the labor force. So, it was the lower denominator, the labor force, not the numerator, the number employed, that lowered the unemployment rate. Not what the consensus thought. Worse, according to Economist David Rosenberg, the shrinkage in the labor force since February is the largest on record (records kept since 1948). [In February, the labor force numbered 164.2 million. In November, it was 160.5 million. That means 3.7 million people who had a job, or were looking in February, have simply given up and dropped out. They are no longer counted in the unemployment data, but they should be. That would add 2.3 percentage points to the U3 rate.]
A couple of charts shed more light on the deteriorating employment data. The first of these is the number of unemployed for 27+ weeks. That number is now near four million.
Unemployed for 27 Weeks and Over United States
St. Louis FRED
Once in this category, the tendency is just to give up (thus the rising number of labor force drop-outs discussed above). And analysis shows that the long-term unemployed become less and less marketable. As this number rises, we can expect to see the labor force continue to shrink in the coming months, perhaps at a faster rate than it has done since February. This is going to be a real economic and political issue going forward.
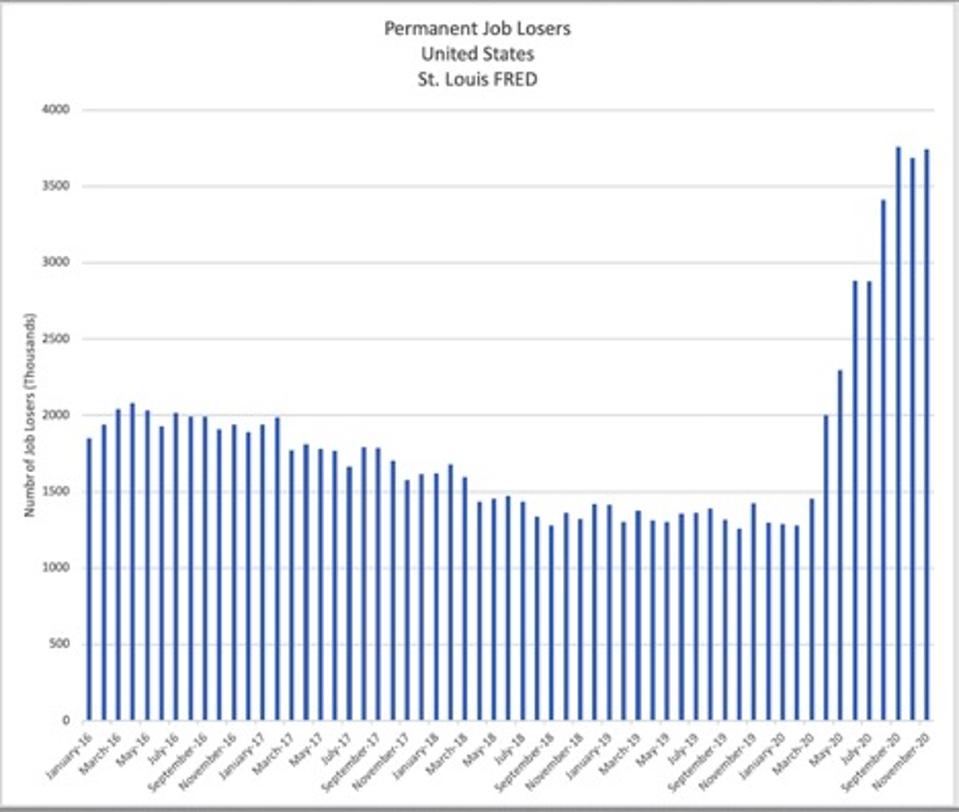
The next chart shows the number of “permanent” job losers, people whose jobs have simply been eliminated, is now about 3.75 million. Back in February, these employees were told that they were “temporarily” on furlough. But, as the pandemic has lingered, employers have either closed or restructured, and their jobs simply disappeared.
Permanent Job Losers
St. Louis FRED
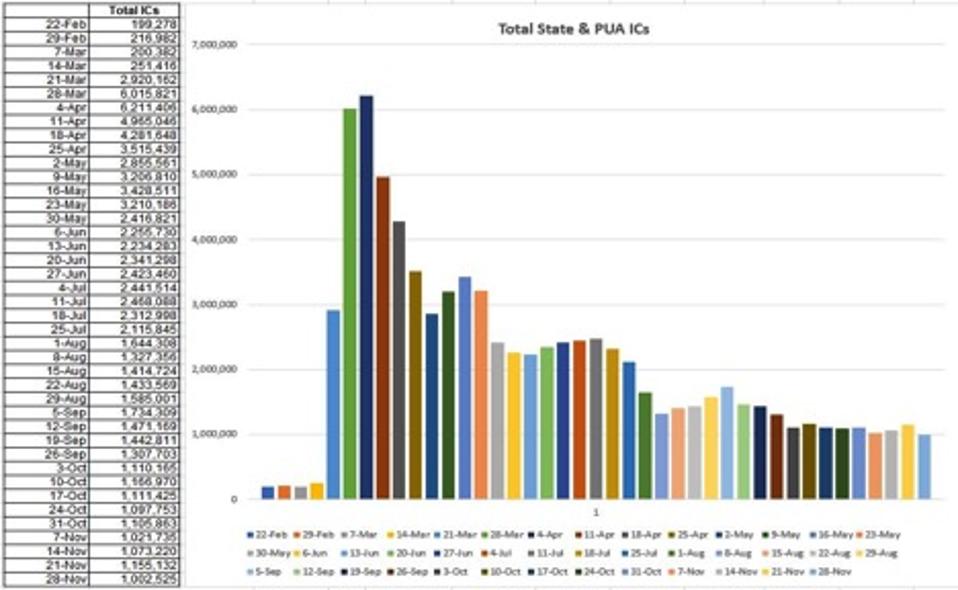
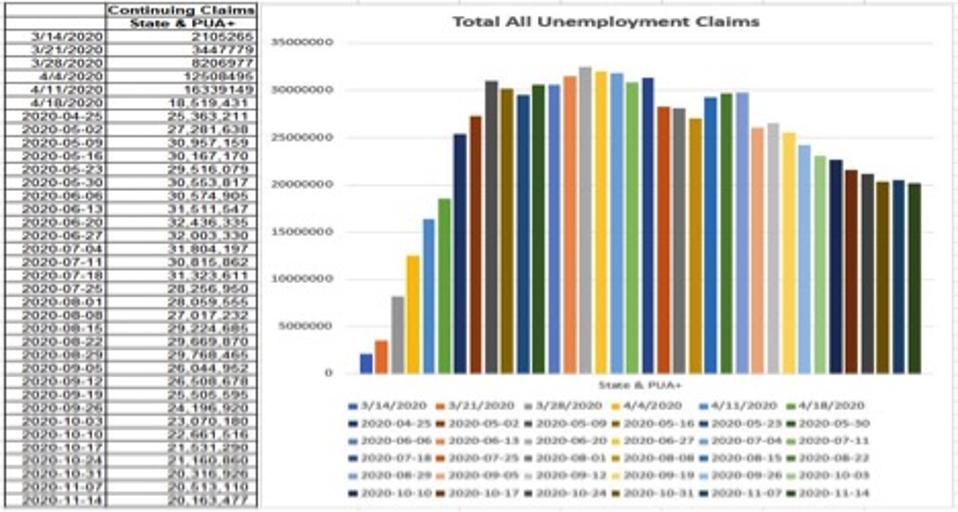
There are two unemployment assistance programs: the regular state programs and the PUA (Pandemic Unemployment Assistance), created by the CARES Act (and scheduled to disappear on December 31st without Congressional action – now expected). The data show some improvement for the week of November 28th, most likely because of the exhaustion of eligibility, not because of an improving jobs market. Note that the data for the two programs, nine months into the pandemic is still in-excess of a million (see chart). This is a measure of weekly layoffs! And if we look at Continuing Claims, i.e., people who have been collecting for more than a week, the total of state and PUA claims remain in-excess-of 20 million! (see chart) The slight downtrend in this chart, too, is more likely due to benefit exhaustion than an improvement in the job market. So, the charts, dire as they are, likely understate the true picture.
The sad truth is that there isn’t any encouraging published employment data. The monthly ADP survey showed +307K for November, similar to the Payroll Survey (+245K). In September, ADP’s number was +754K. Challenger, Gray, and Christmas said they saw nearly 65K pink slips in November, the most, they said, for any November since 2008. And remember, most of these surveys were taken in early to mid-November. Since then we’ve seen added restraints on businesses throughout the country. In California, we now have stay-at-home orders.
Total State & PUA ICs
Universal Value Advisors
Total All Unemployment Claims
Universal Value Advisors
Stimulus
There is the burning question of whether-or-not there will be additional government support prior to the December 31st termination of the CARES Act programs. The latest PUA data, week of November 14th, shows 8.9 million on the regular PUA program and 4.6 million on the “Emergency” program. That’s 13.5 million. The expectation here is that there will be an extension. Unfortunately, the current model is to a) borrow from the future (i.e., not require any work or repayment, but just gift the funds), and b) to give more than the individual was making in their old job. Precisely for this reason, we see many reports, including in the Fed’s Beige Book, of employers not being able to find employees despite the record number of unemployed.
A Cautionary Note: When the CARES Act was passed, the pandemic was expected to last a couple of quarters. Certainly, it was thought, that it would pass by year’s end. But, as we all realize, it may yet linger for several more quarters. The result is that consumers may be a lot less likely to quickly spend any new or extended benefits. And, the fact that the vaccines are coming may actually discourage economic activity, as consumers “play-it-safe” while waiting for their number to be called in the vaccine lottery.
Other Data
There are other economic indicators besides the labor data. Almost all these, too, are downbeat:
The amount of money consumers spent between Thanksgiving and Cyber Monday dropped -14% Y/Y. There was a big shift to on-line sales (+8% Y/Y) but it wasn’t enough to offset the -37% fall in in-person transactions.
The ISM Manufacturing Index, while still positive at 57.5 in November was lower than October’s 59.3 and disappointed the consensus estimate (58.0). The employment sub-index was 48.4 (Nov.), showing contraction vs. 53.2 (Oct.). (50 is the demarcation between expansion and contraction.)
The ISM Non-Manufacturing Index also fell in November (55.9 vs. 56.6). Like the Manufacturing Index, this was still positive, but definitely showing signs of deceleration.
The Fed’s Beige Book, a compendium of business sentiment in the 12 Federal Reserve Districts said that “four districts described little or no growth” and “three of the four Midwestern Districts observed that activity began to slow in early November as COVID-19 cases surged.” Again, remember that these observations are from early November, prior to the renewal of business restraints.
Even Southwest Airlines, a company that has NEVER had a single layoff, said it possibly could furlough 6,800 to cut costs.
On the financial side, the Beige Book reported that “Contacts in numerous Districts reported some deterioration of loan portfolios, particularly for commercial lending into the retail and leisure and hospitality sectors. An increase in delinquencies in 2021 is more widely anticipated… many contacts cited concerns over the recent pandemic wave, mandated restrictions (recent and prospective), and the looming expiration dates for unemployment benefits and for moratoriums on evictions and foreclosures.”
Markets
If, on an MBA examination, a student was only given the above data for the state of the economy, and nothing else, and asked to predict how the equity market would perform, any student indicating new record highs would likely receive no credit for such an answer. Yet, every one of the major indexes closed at new all-time-record highs on Friday, December 4th (DOW: 30,218; S&P 500: 3,699; Nasdaq: 12,464). Possible explanations?
Perhaps markets were looking through the abyss to the other side, especially since there are now at least three viable vaccines. A return to “normal” could be “close at hand.”
Horrible employment data: Normally, Friday’s employment data, along with the clear deceleration in economic activity, would have knocked the equity markets for a loop. But No! That poor employment data was seen spurring the Congress to quickly move to break the political logjam and provide more stimulus (e.g., helicopter money!). Markets love stimulus!
The truth is, the equity market has been divorced from Harry Markowitz’s Capital Asset Pricing Model (CAPM) (yes, the one taught in every MBA program in the country) since Bernanke unleashed the original Quantitative Easing program. (By the way, Markowitz was awarded the Nobel Prize in Economics in 1990 for the CAPM.) Or, perhaps it was Greenspan’s protection of financial markets that decoupled CAPM from Mr. Market (i.e., the “Greenspan Put”).
Equity markets are hooked on easy money, and easy money is what the Fed, the Congress, and nearly every politician wants. M2, for example, is up 25% Y/Y. And, now, as if deficits and debt weren’t simply awful in a Republican Administration, it appears that we are about to unleash the official acceptance of “Modern Monetary Theory” (MMT) (i.e., a sovereign nation can print as much money as it wants), an abomination of an economic theory, but something acceptable to the political class, as they won’t have to defend debt and deficit spending anymore.
Someday, economic fundamentals will again mean something. Likely, not tomorrow. The money printing game is going to continue for the foreseeable future. And markets are going to respond accordingly. What event or series of events precipitates the return of economic fundaments is unknown. Neither is the timing. For the investor class, “vigilance” should be the new operative watchword.
TORONTO – Strength in the base metal and technology sectors helped Canada’s main stock index gain almost 100 points on Friday, while U.S. stock markets also climbed higher.
The S&P/TSX composite index closed up 93.51 points at 23,568.65.
In New York, the Dow Jones industrial average was up 297.01 points at 41,393.78. The S&P 500 index was up 30.26 points at 5,626.02, while the Nasdaq composite was up 114.30 points at 17,683.98.
The Canadian dollar traded for 73.61 cents US compared with 73.58 cents US on Thursday.
The October crude oil contract was down 32 cents at US$68.65 per barrel and the October natural gas contract was down five cents at US$2.31 per mmBTU.
The December gold contract was up US$30.10 at US$2,610.70 an ounce and the December copper contract was up four cents US$4.24 a pound.
This report by The Canadian Press was first published Sept. 13, 2024.
OTTAWA – Statistics Canada says wholesale sales, excluding petroleum, petroleum products, and other hydrocarbons and excluding oilseed and grain, rose 0.4 per cent to $82.7 billion in July.
The increase came as sales in the miscellaneous subsector gained three per cent to reach $10.5 billion in July, helped by strength in the agriculture supplies industry group, which rose 9.2 per cent.
The food, beverage and tobacco subsector added 1.7 per cent to total $15 billion in July.
The personal and household goods subsector fell 2.5 per cent to $12.1 billion.
In volume terms, overall wholesale sales rose 0.5 per cent in July.
Statistics Canada started including oilseed and grain as well as the petroleum and petroleum products subsector as part of wholesale trade last year, but is excluding the data from monthly analysis until there is enough historical data.
This report by The Canadian Press was first published Sept. 13, 2024.
TORONTO – Canada’s main stock index was up more than 150 points in late-morning trading, helped by strength in the base metal and energy sectors, while U.S. stock markets were mixed.
The S&P/TSX composite index was up 172.18 points at 23,383.35.
In New York, the Dow Jones industrial average was down 34.99 points at 40,826.72. The S&P 500 index was up 10.56 points at 5,564.69, while the Nasdaq composite was up 74.84 points at 17,470.37.
The Canadian dollar traded for 73.55 cents US compared with 73.59 cents US on Wednesday.
The October crude oil contract was up $2.00 at US$69.31 per barrel and the October natural gas contract was up five cents at US$2.32 per mmBTU.
The December gold contract was up US$40.00 at US$2,582.40 an ounce and the December copper contract was up six cents at US$4.20 a pound.
This report by The Canadian Press was first published Sept. 12, 2024.