Ranked: The Top Economies in the World (1980‒2075) - Visual Capitalist | Canada News Media
Connect with us

Economy

Ranked: The Top Economies in the World (1980‒2075) – Visual Capitalist

Published

 on


Published

on

<!– View count beta – CS

| 44 views

–>


Visualizing the Top Economies in the World

According to a recent report from Goldman Sachs, the balance of global economic power is projected to shift dramatically in the coming decades.

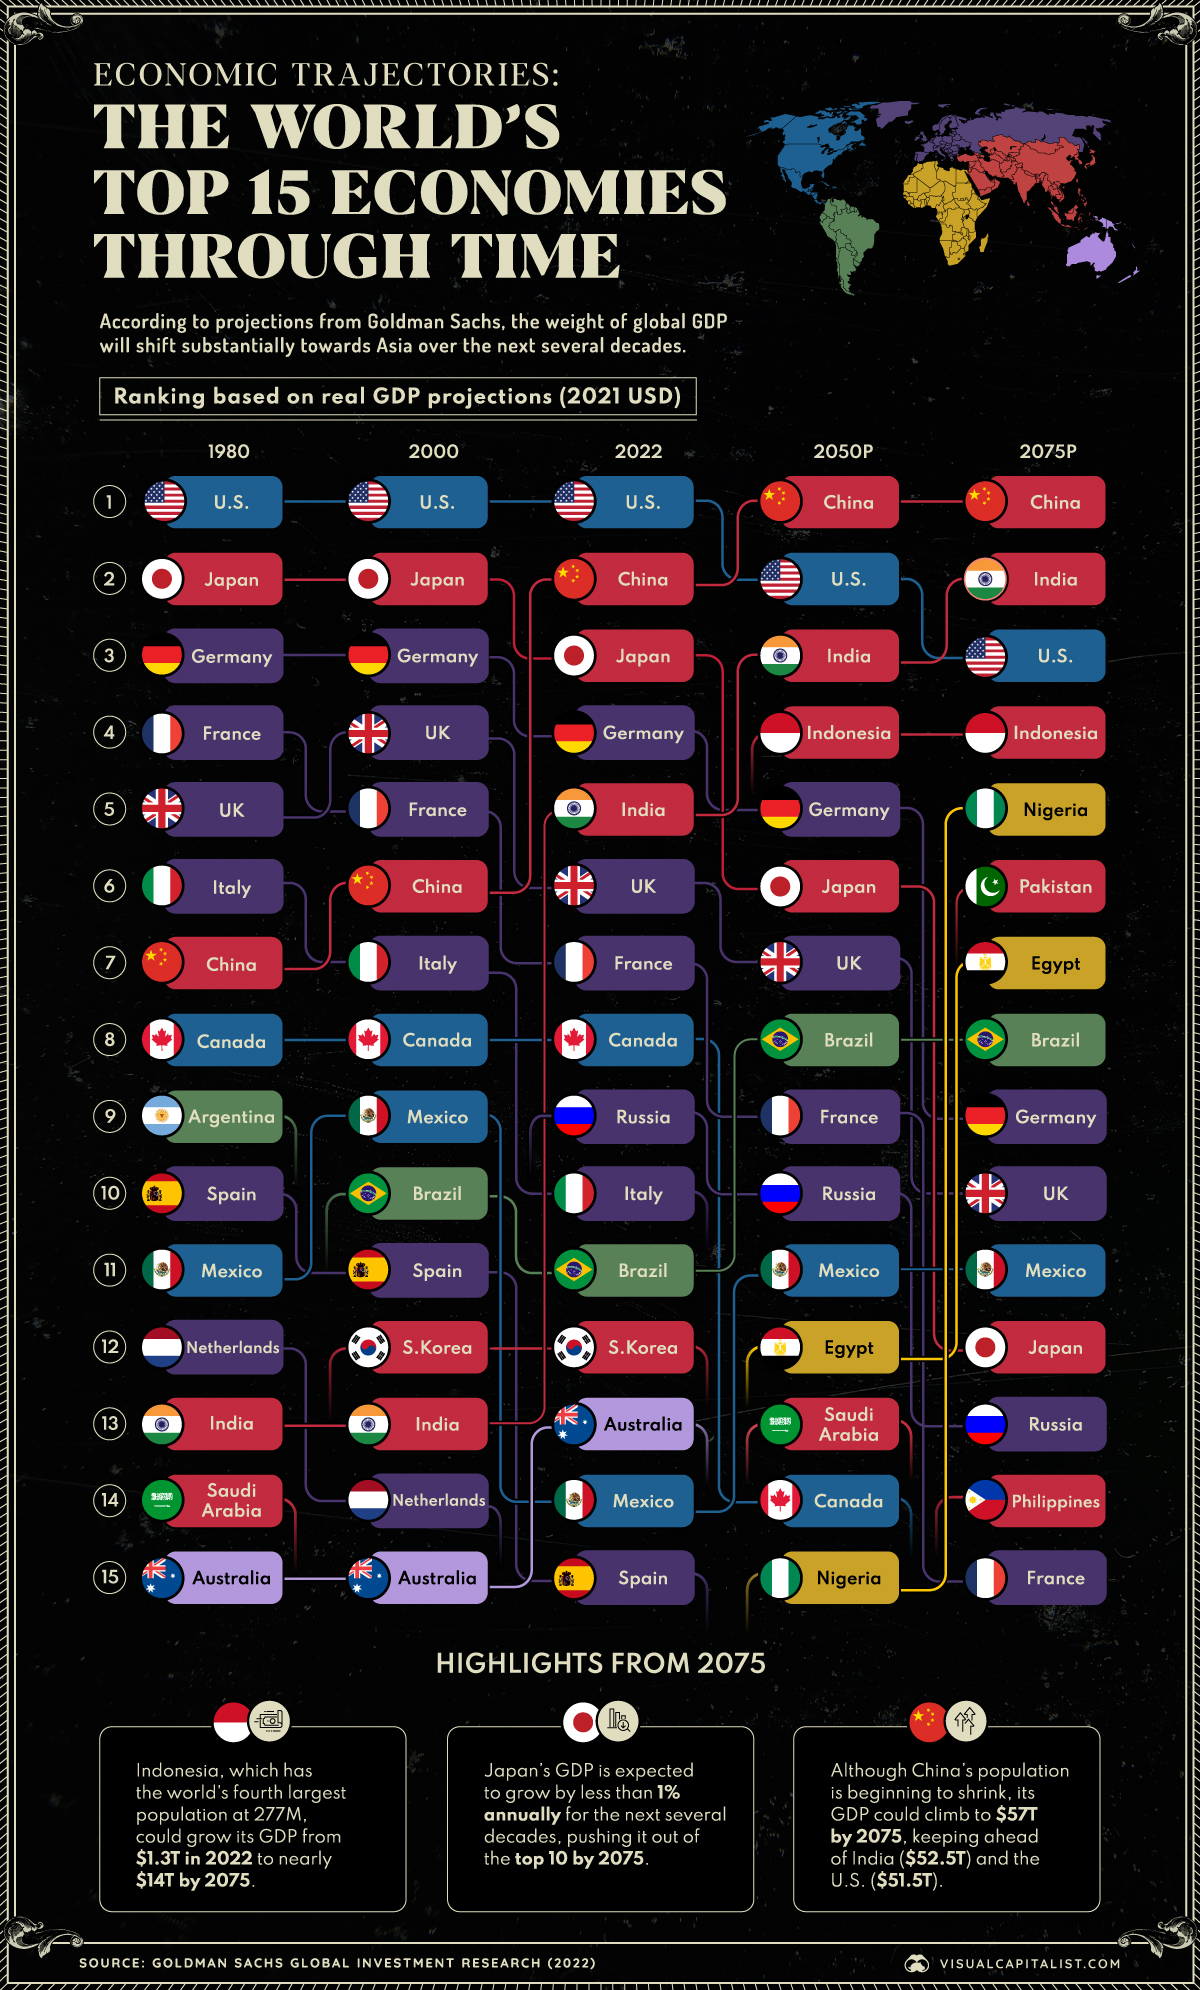
In the graphic above, we’ve created a bump chart that provides a historical and predictive overview of the world’s top 15 economies at several milestones: 1980, 2000, 2022, and Goldman Sachs projections for 2050 and 2075.

Projections and Highlights for 2050

The following table shows the projected top economies in the world for 2050. All figures represent real GDP projections, based on 2021 USD.

Rank Country Real GDP in 2050 (USD trillions)
1 ???????? China $41.9
2 ???????? US $37.2
3 ???????? India $22.2
4 ???????? Indonesia $6.3
5 ???????? Germany $6.2
6 ???????? Japan $6.0
7 ???????? UK $5.2
8 ???????? Brazil $4.9
9 ???????? France $4.6
10 ???????? Russia $4.5
11 ???????? Mexico $4.2
12 ???????? Egypt $3.5
13 ???????? Saudi Arabia $3.5
14 ???????? Canada $3.4
15 ???????? Nigeria $3.4

A major theme of the past several decades has been China and India’s incredible growth. For instance, between 2000 and 2022, India jumped eight spots to become the fifth largest economy, surpassing the UK and France.

By 2050, Goldman Sachs believes that the weight of global GDP will shift even more towards Asia. While this is partly due to Asia outperforming previous forecasts, it is also due to BRICS nations underperforming.

Notably, Indonesia will become the fourth biggest economy by 2050, surpassing Brazil and Russia as the largest emerging market. Indonesia is the world’s largest archipelagic state, and currently has the fourth largest population at 277 million.

The Top Economies in the World in 2075

The following table includes the underlying numbers for 2075. Once again, figures represent real GDP projections, based on 2021 USD.

Rank Country Real GDP in 2075 (USD trillions)
1 ???????? China $57.0
2 ???????? India $52.5
3 ???????? US $51.5
4 ???????? Indonesia $13.7
5 ???????? Nigeria $13.1
6 ???????? Pakistan $12.3
7 ???????? Egypt $10.4
8 ???????? Brazil $8.7
9 ???????? Germany $8.1
10 ???????? UK $7.6
11 ???????? Mexico $7.6
12 ???????? Japan $7.5
13 ???????? Russia $6.9
14 ???????? Philippines $6.6
15 ???????? France $6.5

Projecting further to 2075 reveals a drastically different world order, with Nigeria, Pakistan, and Egypt breaking into the top 10. A major consideration in these estimates is rapid population growth, which should result in a massive labor force across all three nations.

Meanwhile, European economies will continue to slip further down the rankings. Germany, which was once the world’s third largest economy, will sit at ninth behind Brazil.

It should also be noted that China, India, and the U.S. are expected to have similar GDPs by this time, suggesting somewhat equal economic power. As a result, how these nations choose to engage with one another is likely to shape the global landscape in ways that have far-reaching implications.

Adblock test (Why?)


Source link

Continue Reading

Economy

S&P/TSX composite gains almost 100 points, U.S. stock markets also higher

Published

 on


TORONTO – Strength in the base metal and technology sectors helped Canada’s main stock index gain almost 100 points on Friday, while U.S. stock markets also climbed higher.

The S&P/TSX composite index closed up 93.51 points at 23,568.65.

In New York, the Dow Jones industrial average was up 297.01 points at 41,393.78. The S&P 500 index was up 30.26 points at 5,626.02, while the Nasdaq composite was up 114.30 points at 17,683.98.

The Canadian dollar traded for 73.61 cents US compared with 73.58 cents US on Thursday.

The October crude oil contract was down 32 cents at US$68.65 per barrel and the October natural gas contract was down five cents at US$2.31 per mmBTU.

The December gold contract was up US$30.10 at US$2,610.70 an ounce and the December copper contract was up four cents US$4.24 a pound.

This report by The Canadian Press was first published Sept. 13, 2024.

Companies in this story: (TSX:GSPTSE, TSX:CADUSD)

The Canadian Press. All rights reserved.

Source link

Continue Reading

Economy

Statistics Canada reports wholesale sales higher in July

Published

 on


OTTAWA – Statistics Canada says wholesale sales, excluding petroleum, petroleum products, and other hydrocarbons and excluding oilseed and grain, rose 0.4 per cent to $82.7 billion in July.

The increase came as sales in the miscellaneous subsector gained three per cent to reach $10.5 billion in July, helped by strength in the agriculture supplies industry group, which rose 9.2 per cent.

The food, beverage and tobacco subsector added 1.7 per cent to total $15 billion in July.

The personal and household goods subsector fell 2.5 per cent to $12.1 billion.

In volume terms, overall wholesale sales rose 0.5 per cent in July.

Statistics Canada started including oilseed and grain as well as the petroleum and petroleum products subsector as part of wholesale trade last year, but is excluding the data from monthly analysis until there is enough historical data.

This report by The Canadian Press was first published Sept. 13, 2024.

The Canadian Press. All rights reserved.

Source link

Continue Reading

Economy

S&P/TSX composite up more than 150 points, U.S. stock markets mixed

Published

 on


TORONTO – Canada’s main stock index was up more than 150 points in late-morning trading, helped by strength in the base metal and energy sectors, while U.S. stock markets were mixed.

The S&P/TSX composite index was up 172.18 points at 23,383.35.

In New York, the Dow Jones industrial average was down 34.99 points at 40,826.72. The S&P 500 index was up 10.56 points at 5,564.69, while the Nasdaq composite was up 74.84 points at 17,470.37.

The Canadian dollar traded for 73.55 cents US compared with 73.59 cents US on Wednesday.

The October crude oil contract was up $2.00 at US$69.31 per barrel and the October natural gas contract was up five cents at US$2.32 per mmBTU.

The December gold contract was up US$40.00 at US$2,582.40 an ounce and the December copper contract was up six cents at US$4.20 a pound.

This report by The Canadian Press was first published Sept. 12, 2024.

Companies in this story: (TSX:GSPTSE, TSX:CADUSD)

The Canadian Press. All rights reserved.

Source link

Continue Reading

Trending

Exit mobile version