adplus-dvertising
Connect with us

Science

Regular old rock? Think again. Here’s your guide to erratic boulders in Alberta

Published

 on

If you’re taking a walk just east of Calgary’s Coventry Hills neighbourhood, you may dismiss it as a regular old rock covered in graffiti.

But to Lincoln Friske, it’s a local treasure.

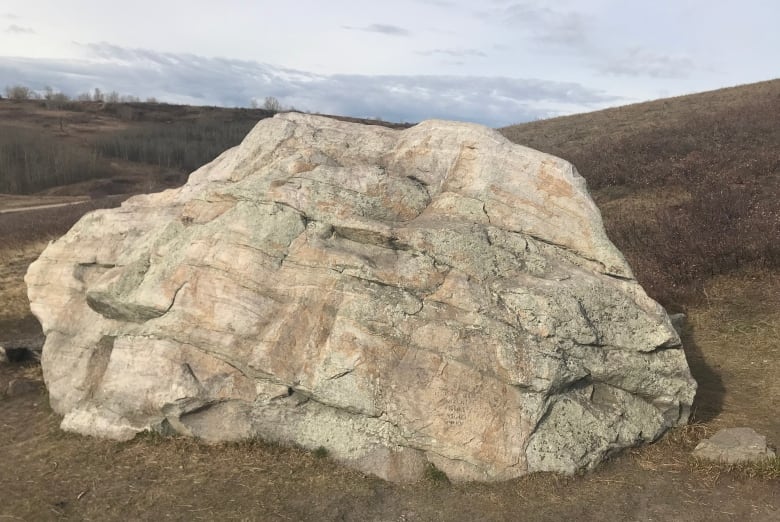
A large erratic boulder sits just past Nose Creek Park. Friske visits the massive rock on his daily dog walks, and he decided recently to create a digital 3D model of it so others could appreciate it, too.

“It’s set up just like an anomaly in the middle of this massive park,” he said in an interview on the Calgary Eyeopener. “Most people didn’t even know there was this graffiti erratic in our own backyard.”

300x250x1

Erratics are stones, boulders or big blocks picked up and moved by glaciers from one place to another during the last ice age.

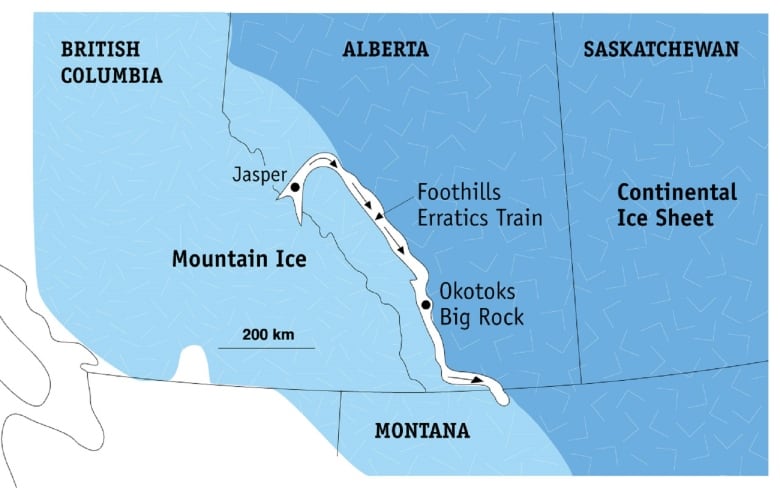
There are thousands dotting the Foothills, part of a 600-kilometre section known as the Foothills Erratics Train. It runs from about Hinton, Alta., all the way down to the Montana border.

Eva Enkelmann, an associate professor in the University of Calgary’s department of geoscience, says the boulders typically look out of place.

“It almost looks like it fell out of the sky. What that means is it doesn’t really match with the rocks you find in that area,” she said.

The stones are typically white, grey or slightly pink.

They’re made of quartzite — or cemented sand grains — dating back some 500 million years, according to Dale Leckie, geologist and author of The Scenic Geology of Alberta: A Roadside Touring And Hiking Guide.

This large boulder sits in Nose Hill Park, part of the Foothills Erratics Train. (Submitted by Dale Leckie)

Researchers have traced the material back to Mount Edith Cavell in Jasper National Park, about 300 kilometres northwest of Calgary.

“They are a very distinctive type of rock,” Leckie said.

“You can see features inside them, which geologists call cross-beds. They’re structures from the waves and the tides when they were deposited.”

So how did they get here?

About 20,000 years ago, a landslide occurred in Jasper National Park.

The tumbling boulders fell onto valley glaciers in the Athabasca River valley. They floated north, then east, then bumped into the Laurentide ice sheet, which covered most of Canada at the time, and were redirected southward, Leckie said.

Over time, they became scattered across the Foothills.

“When the ice melted, eventually it just let them down, I’ll say almost gently, onto the landscape, slipping, sliding back and forth,” Leckie said.

A map illustrates where the Foothills Erratics Train runs along the Rockies.
The Foothills Erratics Train runs from about Hinton, Alta., all the way down to the Montana border. (Government of Alberta)

Most of the erratic boulders landed in their current resting spots about 16,000 years ago.

Another distinctive feature is how solid the erratics are, Enkelmann said.

“Only rocks that are very, very hard actually survive such a long transport,” she said. “The river would usually round the boulders and eventually they turn into pebbles.”

If you look closely, though, some of the boulders do have some round edges along their lower portions.

That’s because hundreds of years ago, bison used to rub up on the boulders to get rid of their winter coats, Leckie said, creating more polished bits. They also created depressions around the boulders known as buffalo wallows.

Where are they?

You can stumble upon an erratic boulder in many farmers’ fields running along the Rocky Mountains, Leckie said, but some of the rocks have become famous landmarks.

The largest and most well-known example would be the Okotoks erratic — also known as Big Rock — which is about the size of a three-storey apartment building. A 3D model of the erratic is also available courtesy of the University of Calgary.

Blue signs describing the history of the rock sit on sidewalks, with the massive Okotoks erratic in the distance.
The Okotoks erratic is protected by the Government of Alberta for its geological and cultural importance. (Submitted by Dale Leckie)

The province designated Big Rock a provincial historic resource in 1978 to protect its geological and cultural importance.

“I think they’re so interesting because they’re just giant blocks,” Leckie said.

“They really grab your attention … they just jump out in the landscape because they’re standing high almost like sentinels.”

Several notable erratics are located in Calgary, including the one documented near Coventry Hills.

One sits on top of Nose Hill Park. Another, known as Split Rock, is in the city’s northeast, just off Harvest Hills Boulevard and Beddington Trail N.W.

A large rock split in half sits in a park.
Split rock can be found in Confluence Park in Calgary’s Beddington Heights neighbourhood. (Submitted by Dale Leckie)

Leckie has seen others in a McKenzie Lake playground and a Tuscany rest area. In Panorama Hills, there’s an erratic — sometimes referred to as crater rock — in a small park.

There are hundreds more, says Enkelmann, and once you’re aware of them, you’ll start to notice them everywhere.

“For me, it’s fascinating that you can weave this whole story by looking at these erratics here in the city, where we are relatively far away from the mountains but we have this evidence,” she said.

728x90x4

Source link

Continue Reading

Science

Potential to locate life on Mars with Artificial Intelligence – Innovation News Network

Published

 on


An international team of researchers has found that Artificial Intelligence (AI) can help identify hidden patterns within geographical data that could indicate life on Mars.  

As there are only a few opportunities to collect samples from Mars in the search for life beyond Earth, it is crucial that these missions target locations that have the best chance of harbouring extra-terrestrial life. The new study, led by an international team of over 50 researchers, ensures that this can be supported by using Artificial Intelligence and Machine Learning methods. This technology can be used to identify hidden patterns within geographical data that could indicate the presence of life on Mars. 

The work, ‘Orbit-to-Ground Framework to Decode and Predict Biosignature Patterns in Terrestrial Analogues,’ has been published in Nature Astronomy.  

The resulting model was capable of locating biosignatures that have the potential to indicate life on Mars 

The first part of the study, led by Dr Kimberley Warren-Rhodes at the SETI Institute, was an ecological survey of a 3 km² area in the Salar de Pajonales basin, at the boundary of the Chilean Atacama Desert and Altiplano in South America. This was used to map the distribution of photosynthetic microorganisms. Gene sequencing and infrared spectroscopy were also used to reveal distinct markers of life, called ‘biosignatures.’ Aerial images were then combined with this data to train a Machine Learning model to predict which macro- and microhabitat types would be associated with biosignatures that could indicate life on Mars and other areas. 

300x250x1

The resulting model could locate and detect biosignatures up to 87.5% of the time on data on which it was not trained. This decreased the search area required to find a positive result by up to 97%. In the future, life on Mars could be detected through the identification of the areas most likely to contain signs of life. These can then be extensively searched by rovers. 

© shutterstock

Dr Freddie Kalaitzis from the University of Oxford’s Department of Computer Science led the application of Machine Learning methods to microhabitat data. He said: “This work demonstrates an AI-guided protocol for searching for life on a Mars-like terrestrial analogue on Earth. This protocol is the first of its kind trained on actual field data, and its application can, in principle, generalise to other extreme life-harbouring environments. Our next steps will be to test this method further on Earth with the aim that it will eventually aid our exploration for biosignatures elsewhere in the solar system, such as Mars, Titan, and Europa.” 

On Earth, one of the most similar analogues to Mars is the Pajonales, a four-million-year-old lakebed. This area is considered to be inhospitable to most forms of life. Comparable to the evaporitic basins of Mars, the high altitude (3,541 m) basin experiences exceptionally strong levels of ultraviolet radiation, hypersalinity, and low temperatures. 

Water availability is likely to be the key factor determining the position of biological hotspots 

The researchers collected over 7,700 images and 1,150 samples and tested for the presence of photosynthetic microbes living within the salt domes, rocks, and alabaster crystals that make up the basin’s surface. Here, biosignature markers, such as carotenoid and chlorophyll pigments, could be seen as orange-pink and green layers respectively. 

Ground sampling data and 3D topographical mapping were combined with the drone images to classify regions into four macrohabitats (metre to kilometre scales) and six microhabitats (centimetre scale). The team found that the microbial organisms across the study site were clustered in distinct regions, despite the Pajonales having a near-uniform mineral composition.  

Follow-up experiments showed that rather than environmental variables, like nutrient or light availability, determining the position of, biological hotspots water availability is the most likely factor.  

[embedded content]

The combined dataset was used to train convolutional neural networks to predict which macro- and microhabitats were most strongly associated with biosignatures.  

“For both the aerial images and ground-based centimetre-scale data, the model demonstrated high predictive capability for the presence of geological materials strongly likely to contain biosignatures,” said Dr Kalaitzis.  

“The results aligned well with ground-truth data, with the distribution of biosignatures being strongly associated with hydrological features.” 

The model will be used to map other harsh ecosystems  

Now, the researchers aim to test the model’s ability to predict the location of similar yet different natural systems in the Pajonales basin, such as ancient stromatolite fossils. The model will also be used to map other harsh ecosystems, including hot springs and permafrost soils. The data from these studies will inform and test hypotheses on the mechanisms that living organisms use to survive in extreme environments. 

“Our study has once again demonstrated the power of Machine Learning methods to accelerate scientific discovery through its ability to analyse immense volumes of different data and identify patterns that would be indiscernible to a human being,” Dr Kalaitzis added.  

“Ultimately, we hope the approach will facilitate the compilation of a databank of biosignature probability and habitability algorithms, roadmaps, and models that can serve as a guide for exploration of life on Mars.” 

Subscribe to our newsletter

Adblock test (Why?)

728x90x4

Source link

Continue Reading

Science

By cracking a metal 3D-printing conundrum, researchers propel the technology toward widespread application – EurekAlert

Published

 on


image: Researchers used high-speed X-ray diffraction to identify the crystal structures that form within steel as it is 3D-printed. The angle at which the X-rays exit the metal correspond to types of crystal structures within.
view more 

Credit: H. König et al. via Creative Commons (https://creativecommons.org/licenses/by/4.0/), adapted by N. Hanacek/NIST

Researchers have not yet gotten the additive manufacturing, or 3D printing, of metals down to a science completely. Gaps in our understanding of what happens within metal during the process have made results inconsistent. But a new breakthrough could grant an unprecedented level of mastery over metal 3D printing. 

Using two different particle accelerator facilities, researchers at the National Institute of Standards and Technology (NIST), KTH Royal Institute of Technology in Sweden and other institutions have peered into the internal structure of steel as it was melted and then solidified during 3D printing. The findings, published in Acta Materialia, unlock a computational tool for 3D-printing professionals, offering them a greater ability to predict and control the characteristics of printed parts, potentially improving the technology’s consistency and feasibility for large-scale manufacturing.   

A common approach for printing metal pieces involves essentially welding pools of powdered metal with lasers, layer by layer, into a desired shape. During the first steps of printing with a metal alloy, wherein the material rapidly heats up and cools off, its atoms — which can be a smattering of different elements — pack into ordered, crystalline formations. The crystals determine the properties, such as toughness and corrosion resistance, of the printed part. Different crystal structures can emerge, each with their own pros and cons. 

300x250x1

“Basically, if we can control the microstructure during the initial steps of the printing process, then we can obtain the desired crystals and, ultimately, determine the performance of additively manufactured parts,” said NIST physicist Fan Zhang, a study co-author. 

While the printing process wastes less material and can be used to produce more complicated shapes than traditional manufacturing methods, researchers have struggled to grasp how to steer metal toward particular kinds of crystals over others.  

This lack of knowledge has led to less than desirable results, such as parts with complex shapes cracking prematurely thanks to their crystal structure.  

“Among the thousands of alloys that are commonly manufactured, only a handful can be made using additive manufacturing,” Zhang said. 

Part of the challenge for scientists has been that solidification during metal 3D printing occurs in the blink of an eye.  

To capture the high-speed phenomenon, the authors of the new study employed powerful X-rays generated by cyclic particle accelerators, called synchrotrons, at Argonne National Laboratory’s Advanced Photon Source and the Paul Scherrer Institute’s Swiss Light Source.  

The team sought to learn how the cooling rates of metal, which can be controlled by laser power and movement settings, influence crystal structure. Then the researchers would compare the data to the predictions of a widely used computational model developed in the ’80s that describes the solidification of alloys.  

While the model is trusted for traditional manufacturing processes, the jury has been out on its applicability in the unique context of 3D printing’s rapid temperature shifts.  

“Synchrotron experiments are time consuming and expensive, so you cannot run them for every condition that you’re interested in. But they are very useful for validating models that you then can use to simulate the interesting conditions,” said study co-author Greta Lindwall, an associate professor of materials science and engineering at KTH Royal Institute of Technology. 

Within the synchrotrons, the authors set up additive manufacturing conditions for hot-work tool steel — a kind of metal used to make, as the name suggests, tools that can withstand high temperatures.  

As lasers liquified the metal and different crystals emerged, X-ray beams probed the samples with enough energy and speed to produce images of the fleeting process. The team members required two separate facilities to support the cooling rates they wanted to test, which ranged from temperatures of tens of thousands to more than a million kelvins per second.  

The data the researchers collected depicted the push and pull between two kinds of crystal structures, austenite and delta ferrite, the latter being associated with cracking in printed parts. As cooling rates surpassed 1.5 million kelvins (2.7 million degrees Fahrenheit) per second, austenite began to dominate its rival. This critical threshold lined up with what the model foretold.  

“The model and the experimental data are nicely in agreement. When we saw the results, we were really excited,” Zhang said.  

The model has long been a reliable tool for materials design in traditional manufacturing, and now the 3D-printing space may be afforded the same support.  

The results indicate that the model can inform scientists and engineers on what cooling rates to select for the early solidification steps of the printing process. That way the optimal crystal structure would appear within their desired material, making metal 3D printing less of a roll of the dice.  

“If we have data, we can use it to validate the models. That’s how you accelerate the widespread adoption of additive manufacturing for industrial use,” Zhang said.


Disclaimer: AAAS and EurekAlert! are not responsible for the accuracy of news releases posted to EurekAlert! by contributing institutions or for the use of any information through the EurekAlert system.

Adblock test (Why?)

728x90x4

Source link

Continue Reading

Science

Deep Impact: Heat Waves Happen at the Bottom of the Ocean Too

Published

 on

This visualization depicts bathymetric features of the western Atlantic Ocean Basin, including the continental shelf, captured by satellite. Credit: NOAA’s National Environmental Satellite and Information Service


First assessment of bottom marine heat waves opens a window on the deep.

The 2013-2016 marine heat wave known as “The Blob” warmed a vast expanse of surface waters across the northeastern Pacific, disrupting West Coast marine ecosystems, depressing salmon returns, and damaging commercial fisheries. It also prompted a wave of research on extreme warming of ocean surface waters.

300x250x1

But, as new research from the National Oceanic and Atmospheric Administration (<span class=”glossaryLink” aria-describedby=”tt” data-cmtooltip=”

NOAA
The National Oceanic and Atmospheric Administration (NOAA) is a scientific agency of the United States government that is focused on understanding and predicting changes in Earth’s oceans, atmosphere, and climate. It is headquartered in Silver Spring, Maryland and is a part of the Department of Commerce. NOAA conducts research and provides information, products, and services that are used to protect life and property, and to support economic growth and development. It also works to conserve and manage natural resources, including fisheries, wildlife, and habitats. Some of the specific activities that NOAA is involved in include weather forecasting, climate monitoring, marine biology and fisheries research, and satellite and remote sensing.


In a paper published in the journal <span class=”glossaryLink” aria-describedby=”tt” data-cmtooltip=”

Nature Communications
&lt;em&gt;Nature Communications&lt;/em&gt; is a peer-reviewed, open-access, multidisciplinary, scientific journal published by Nature Portfolio. It covers the natural sciences, including physics, biology, chemistry, medicine, and earth sciences. It began publishing in 2010 and has editorial offices in London, Berlin, New York City, and Shanghai.&nbsp;

” data-gt-translate-attributes=”[“attribute”:”data-cmtooltip”, “format”:”html”]”>Nature Communications on March 13, a team led by NOAA researchers used a combination of observations and computer models to generate the first broad assessment of bottom marine heat waves in the productive continental shelf waters surrounding North America.

Endangered Fish Marine Heat Waves

Marine heat waves have a significant impact on ocean ecosystems globally, disrupting the productivity and distribution of organisms, from plankton to whales. There is a significant effort to study, track, and predict the timing, intensity, duration, and physical drivers of these events. Credit: NOAA Fisheries


“Researchers have been investigating marine heat waves at the sea surface for over a decade now,” said lead author Dillon Amaya, a research scientist with NOAA’s Physical Science Laboratory. “This is the first time we’ve been able to really dive deeper and assess how these extreme events unfold along shallow seafloors.”


Marine heat waves dramatically impact the health of ocean ecosystems around the globe, disrupting the productivity and distribution of organisms as small as plankton and as large as whales. As a result, there has been a considerable effort to study, track and predict the timing, intensity, duration, and physical drivers of these events.

Most of that research has focused on temperature extremes at the ocean’s surface, for which there are many more high-quality observations taken by satellites, ships, and buoys. Sea surface temperatures can also be indicators for many physical and biochemical ocean characteristics of sensitive marine ecosystems, making analyses more straightforward.

About 90% of the excess heat from global warming has been absorbed by the ocean, which has warmed by about 1.5C over the past century. Marine heatwaves have become about 50% more frequent over the past decade.

Ling Cod Humboldt Bay Jetty in California

Ling cod, like this one caught off of Humboldt Bay Jetty in California, are a member of Pacific groundfish communities vulnerable to impacts from bottom marine heat waves. Credit: Nicholas Easterbrook/NOAA Fisheries


In recent years, scientists have increased efforts to investigate marine heat waves throughout the water column using the limited data available. But previous research didn’t target temperature extremes on the ocean bottom along continental shelves, which provide critical habitat for important commercial <span class=”glossaryLink” aria-describedby=”tt” data-cmtooltip=”

species
A species is a group of living organisms that share a set of common characteristics and are able to breed and produce fertile offspring. The concept of a species is important in biology as it is used to classify and organize the diversity of life. There are different ways to define a species, but the most widely accepted one is the biological species concept, which defines a species as a group of organisms that can interbreed and produce viable offspring in nature. This definition is widely used in evolutionary biology and ecology to identify and classify living organisms.

Due to the relative scarcity of bottom-water temperature datasets, the scientists used a data product called “reanalysis” to conduct the assessment, which starts with available observations and employs computer models that simulate ocean currents and the influence of the atmosphere to “fill in the blanks.” Using a similar technique, NOAA scientists have been able to reconstruct global weather back to the early 19th century.

Average Intensity of Ocean Bottom Heat Waves

These illustrations show the average intensity of bottom heat waves ( heat anomalies) that occurred between 1993 and 2019 in each of the large marine ecosystems studied by a team of NOAA scientists. Credit: NOAA Physical Sciences Laboratory


While ocean reanalyses have been around for a long time, they have only recently become skillful enough and have high enough resolution to examine ocean features, including bottom temperatures, near the coast.


The research team, from NOAA, Cooperative Institute for Research in Environmental Sciences (CIRES), and National Center for Atmospheric Research (NCAR), found that on the continental shelves around North America, bottom marine heat waves tend to persist longer than their surface counterparts, and can have larger warming signals than the overlying surface waters. Bottom and surface marine heat waves can occur simultaneously in the same location, especially in shallower regions where surface and bottom waters mingle.

Lionfish Invasive Species

Lionfish have become a poster child for invasive species issues in the western north Atlantic region. Their populations continue to expand, threatening the well-being of coral reefs and other marine ecosystems. This includes the commercially and recreationally important fish that depend on them. Credit: NOAA Fisheries


But bottom marine heat waves can also occur with little or no evidence of warming at the surface, which has important implications for the management of commercially important fisheries. “That means it can be happening without managers realizing it until the impacts start to show,” said Amaya.

In 2015, a combination of harmful algal blooms and loss of kelp forest habitat off the West Coast of the United States—both caused by The Blob – led to closures of shellfisheries that cost the economy in excess of $185 million, according to a 2021 study. The commercial tri-state Dungeness crab fishery recorded a loss of $97.5 million, affecting both tribal and nontribal fisheries. Washington and Californian coastal communities lost a combined $84 million in tourist spending due to the closure of recreational razor clam and abalone fisheries.


In 2021, a groundfish survey published by NOAA Fisheries indicated that Gulf of Alaska cod had plummeted during The Blob, experiencing a 71% decline in abundance between 2015 and 2017. On the other hand, young groundfish and other marine creatures in the Northern California Current system thrived under the unprecedented ocean conditions, a 2019 paper by Oregon State University and NOAA Fisheries researchers found.

Unusually warm bottom water temperatures have also been linked to the expansion of invasive lionfish along the southeast U.S., coral bleaching and subsequent declines of reef fish, changes in survival rates of young Atlantic cod, and the disappearance of near-shore lobster populations in southern New England.

The authors say it will be important to maintain existing continental shelf monitoring systems and to develop new real-time monitoring capabilities to alert marine resource managers to bottom warming conditions.

“We know that early recognition of marine heat waves is needed for proactive management of the coastal ocean,” said co-author Michael Jacox, a research oceanographer who splits his time between NOAA’s Southwest Fisheries Science Center and the Physical Sciences Laboratory. “Now it’s clear that we need to pay closer attention to the ocean bottom, where some of the most valuable species live and can experience heat waves quite different from those on the surface.”


Reference: “Bottom marine heatwaves along the continental shelves of North America” by Dillon J. Amaya, Michael G. Jacox, Michael A. Alexander, James D. Scott, Clara Deser, Antonietta Capotondi and Adam S. Phillips, 13 March 2023, Nature Communications.
DOI: 10.1038/s41467-023-36567-0


728x90x4

Source link

Continue Reading

Trending