The 60/40 Investment Portfolio Should Expand Its Borders - Yahoo Finance | Canada News Media
Connect with us

Investment

The 60/40 Investment Portfolio Should Expand Its Borders – Yahoo Finance

Published

 on


(Bloomberg Opinion) — The traditional 60/40 portfolio of U.S. stocks and bonds isn’t dead, but it has fallen on hard times. U.S. interest rates are hovering around zero and, even after a coronavirus-induced sell-off, the U.S. stock market isn’t cheap. For adherents of 60/40, it’s a good time to revisit some old assumptions.  

When in doubt, tradition has it, investors should put 60% of their portfolios in U.S. stocks and 40% in bonds. Why 60/40? There’s no satisfying answer. A common explanation is that stocks can be expected to outpace bonds over time, so tilting the portfolio in favor of stocks is an easy way to reach for extra return without excessive risk. And why the U.S.? Well, there’s no place like home.

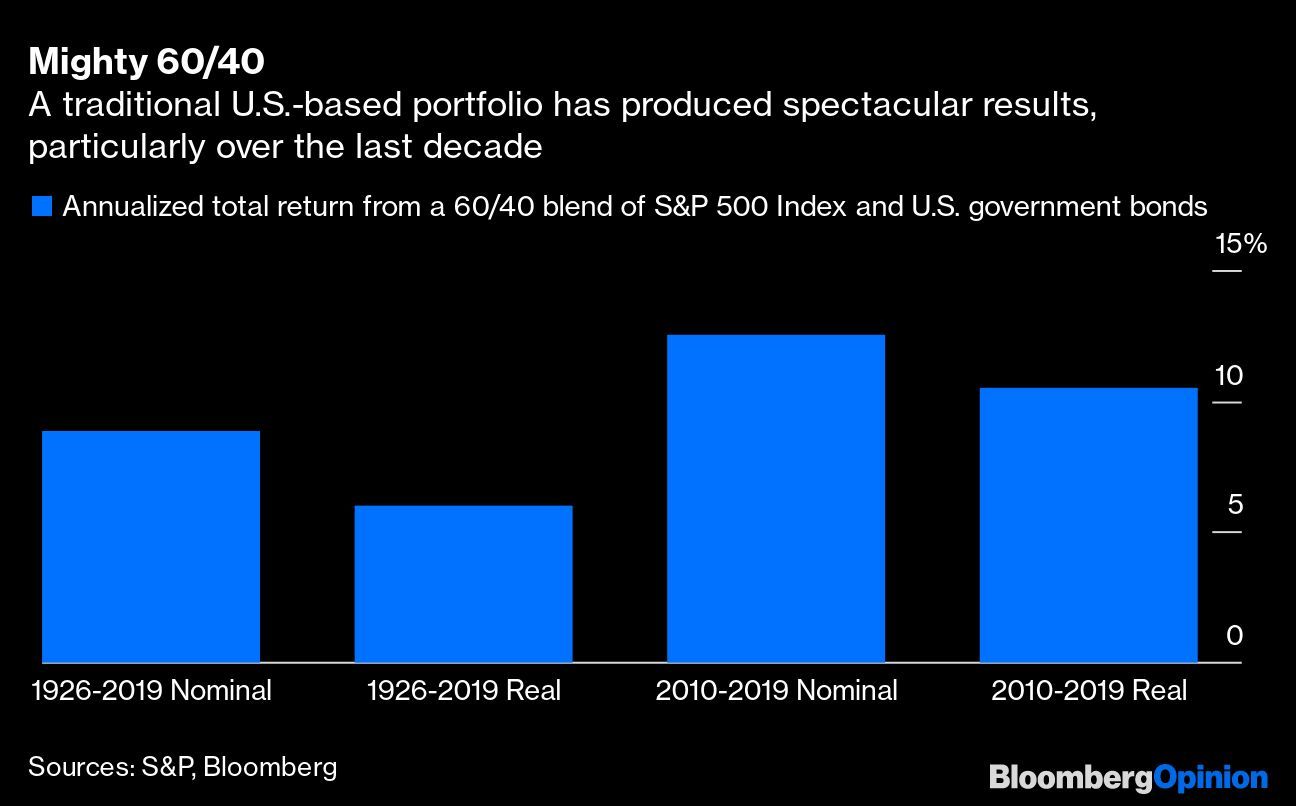
That tradition has paid off. A 60/40 combination of the S&P 500 Index and long-term U.S. government bonds has returned 8.9% a year from 1926 to 2019, including dividends, or 6% a year after inflation. The results were even better during the last decade. The 60/40 portfolio returned 12.6% a year from 2010 to 2019, or 10.5% a year after inflation.

Past isn’t prologue, however, and that admonition has never been more fitting for 60/40 portfolios. A widely cited barometer of real expected returns from stocks is the cyclically adjusted earnings yield, which uses an average of inflation-adjusted earnings over the previous 10 years. That yield for the S&P 500 Index is 4.8%, according to Bloomberg data. Meanwhile, the yield on inflation-protected Treasuries is a negative 0.2%. A 60/40 combination of the two produces an expected return of 2.8% a year after inflation. 

Investors don’t appear to have grasped that reality. In its most recent annual investor survey, French lender Natixis SA reported that U.S. investors expect their portfolios to generate returns of 10.9% a year after inflation. To put that delusion in perspective, the 60/40 U.S. portfolio managed to equal or surpass that mark just 9% of the time since 1926 over rolling 10-year periods, counted monthly. And those periods were all clustered around the 1990s, a decade with an enchanted combination of bond yields that fell from record highs and stock valuations that climbed to records. Suffice it so say, no one expects those tailwinds to return soon.

Those who want a preview of what the next decade might look like should consider the recent experience of investors in other developed countries. Home bias, or the propensity to invest in one’s home country, is common to all investors. A recent paper by FTSE Russell examined euro zone home bias in equity allocations from 2008 to September 2019. It found, for example, that French pension funds invested 88% of their equity portfolios in French companies, which is 29 times France’s weight in the FTSE All-World Index. In Spain, the equity allocation of pension funds to local companies was 67 times the country’s weight in the FTSE index.

Staying home paid off for a time. The MSCI French Index outpaced the MSCI All Country World Index, or ACWI, by 2.6 percentage points a year in euros from 1999 to 2007, including dividends, the earliest year for which numbers are available. And the MSCI Spain Index outpaced ACWI by 5.2 percentage points a year over the same period. 

But the cost of higher stock prices is lower earnings yields. By the end of 2007, the cyclically adjusted earnings yield was 4.2% in France and 3.7% in Spain. Since 2008, French stocks have returned 4% a year through February, lagging ACWI by 3.2 percentage points a year, and Spanish stocks have been flat, trailing ACWI by 7.3 percentage points a year.  

France and Spain are hardly alone. While the U.S. stock market has soared since the 2008 financial crisis, the rest of the world has floundered. The cyclically adjusted earnings yield of the MSCI World ex USA Index, a basket of companies in developed countries outside the U.S., has swelled to 6.5% from 4% at the end of 2007. Similarly, the yield for the MSCI Emerging Markets Index has jumped to 7.2% from 3.8% over the same time. 

Value-minded investors can find even higher yields. The MSCI World ex USA Value Index offers an earnings yield of 9.5%, while the MSCI Emerging Markets Value Index packs a yield of 11%. If there’s ever a time for Americans to start leaving home, this is it.

It won’t be easy. Given 60/40’s stellar past performance, investors are more likely to look back than forward. Also, overseas stocks have been laggards for years and have only tumbled further over time — and nothing repels investors like falling stock prices. The timing isn’t great, either. Everyone wants the comforts of home during a crisis.

Unfortunately, there’s not much investors can do about the 40 because the U.S. still boasts some of the highest bond yields in the developed world. But when it comes to the 60, the value is overseas. So let’s tip our hat to the old 60/40 — and then give it an upgrade. 

This column does not necessarily reflect the opinion of Bloomberg LP and its owners.

Nir Kaissar is a Bloomberg Opinion columnist covering the markets. He is the founder of Unison Advisors, an asset management firm. He has worked as a lawyer at Sullivan & Cromwell and a consultant at Ernst & Young.

<p class="canvas-atom canvas-text Mb(1.0em) Mb(0)–sm Mt(0.8em)–sm" type="text" content="For more articles like this, please visit us at bloomberg.com/opinion” data-reactid=”46″>For more articles like this, please visit us at bloomberg.com/opinion

<p class="canvas-atom canvas-text Mb(1.0em) Mb(0)–sm Mt(0.8em)–sm" type="text" content="Subscribe now to stay ahead with the most trusted business news source.” data-reactid=”47″>Subscribe now to stay ahead with the most trusted business news source.

©2020 Bloomberg L.P.

Let’s block ads! (Why?)


Source link

Continue Reading

Economy

S&P/TSX composite down more than 200 points, U.S. stock markets also fall

Published

 on


TORONTO – Canada’s main stock index was down more than 200 points in late-morning trading, weighed down by losses in the technology, base metal and energy sectors, while U.S. stock markets also fell.

The S&P/TSX composite index was down 239.24 points at 22,749.04.

In New York, the Dow Jones industrial average was down 312.36 points at 40,443.39. The S&P 500 index was down 80.94 points at 5,422.47, while the Nasdaq composite was down 380.17 points at 16,747.49.

The Canadian dollar traded for 73.80 cents US compared with 74.00 cents US on Thursday.

The October crude oil contract was down US$1.07 at US$68.08 per barrel and the October natural gas contract was up less than a penny at US$2.26 per mmBTU.

The December gold contract was down US$2.10 at US$2,541.00 an ounce and the December copper contract was down four cents at US$4.10 a pound.

This report by The Canadian Press was first published Sept. 6, 2024.

Companies in this story: (TSX:GSPTSE, TSX:CADUSD)

The Canadian Press. All rights reserved.

Source link

Continue Reading

Economy

S&P/TSX composite up more than 150 points, U.S. stock markets also higher

Published

 on


TORONTO – Canada’s main stock index was up more than 150 points in late-morning trading, helped by strength in technology, financial and energy stocks, while U.S. stock markets also pushed higher.

The S&P/TSX composite index was up 171.41 points at 23,298.39.

In New York, the Dow Jones industrial average was up 278.37 points at 41,369.79. The S&P 500 index was up 38.17 points at 5,630.35, while the Nasdaq composite was up 177.15 points at 17,733.18.

The Canadian dollar traded for 74.19 cents US compared with 74.23 cents US on Wednesday.

The October crude oil contract was up US$1.75 at US$76.27 per barrel and the October natural gas contract was up less than a penny at US$2.10 per mmBTU.

The December gold contract was up US$18.70 at US$2,556.50 an ounce and the December copper contract was down less than a penny at US$4.22 a pound.

This report by The Canadian Press was first published Aug. 29, 2024.

Companies in this story: (TSX:GSPTSE, TSX:CADUSD)

The Canadian Press. All rights reserved.

Source link

Continue Reading

Investment

Crypto Market Bloodbath Amid Broader Economic Concerns

Published

 on

The crypto market has recently experienced a significant downturn, mirroring broader risk asset sell-offs. Over the past week, Bitcoin’s price dropped by 24%, reaching $53,000, while Ethereum plummeted nearly a third to $2,340. Major altcoins also suffered, with Cardano down 27.7%, Solana 36.2%, Dogecoin 34.6%, XRP 23.1%, Shiba Inu 30.1%, and BNB 25.7%.

The severe downturn in the crypto market appears to be part of a broader flight to safety, triggered by disappointing economic data. A worse-than-expected unemployment report on Friday marked the beginning of a technical recession, as defined by the Sahm Rule. This rule identifies a recession when the three-month average unemployment rate rises by at least half a percentage point from its lowest point in the past year.

Friday’s figures met this threshold, signaling an abrupt economic downshift. Consequently, investors sought safer assets, leading to declines in major stock indices: the S&P 500 dropped 2%, the Nasdaq 2.5%, and the Dow 1.5%. This trend continued into Monday with further sell-offs overseas.

The crypto market’s rapid decline raises questions about its role as either a speculative asset or a hedge against inflation and recession. Despite hopes that crypto could act as a risk hedge, the recent crash suggests it remains a speculative investment.

Since the downturn, the crypto market has seen its largest three-day sell-off in nearly a year, losing over $500 billion in market value. According to CoinGlass data, this bloodbath wiped out more than $1 billion in leveraged positions within the last 24 hours, including $365 million in Bitcoin and $348 million in Ether.

Khushboo Khullar of Lightning Ventures, speaking to Bloomberg, argued that the crypto sell-off is part of a broader liquidity panic as traders rush to cover margin calls. Khullar views this as a temporary sell-off, presenting a potential buying opportunity.

Josh Gilbert, an eToro market analyst, supports Khullar’s perspective, suggesting that the expected Federal Reserve rate cuts could benefit crypto assets. “Crypto assets have sold off, but many investors will see an opportunity. We see Federal Reserve rate cuts, which are now likely to come sharper than expected, as hugely positive for crypto assets,” Gilbert told Coindesk.

Despite the recent volatility, crypto continues to make strides toward mainstream acceptance. Notably, Morgan Stanley will allow its advisors to offer Bitcoin ETFs starting Wednesday. This follows more than half a year after the introduction of the first Bitcoin ETF. The investment bank will enable over 15,000 of its financial advisors to sell BlackRock’s IBIT and Fidelity’s FBTC. This move is seen as a significant step toward the “mainstreamization” of crypto, given the lengthy regulatory and company processes in major investment banks.

The recent crypto market downturn highlights its volatility and the broader economic concerns affecting all risk assets. While some analysts see the current situation as a temporary sell-off and a buying opportunity, others caution against the speculative nature of crypto. As the market evolves, its role as a mainstream alternative asset continues to grow, marked by increasing institutional acceptance and new investment opportunities.

Continue Reading

Trending

Exit mobile version