adplus-dvertising
Connect with us

Science

The Moon's Magnetosphere Used to be Twice as Strong as the Earth's – Universe Today

Published

 on


For decades, scientists have held that the Earth-Moon system formed as a result of a collision between Earth and a Mars-sized object roughly 4.5 billion years ago. Known as the Giant Impact Hypothesis, this theory explains why Earth and the Moon are similar in structure and composition. Interestingly enough, scientists have also determined that during its early history, the Moon had a magnetosphere – much like Earth does today.

However, a new study led by researchers at MIT (with support provided by NASA) indicates that at one time, the Moon’s magnetic field may have actually been stronger than Earth’s. They were also able to place tighter constraints on when this field petered out, claiming it would have happened about 1 billion years ago. These findings have helped resolve the mystery of what mechanism powered the Moon’s magnetic field over time.

300x250x1

The study, which recently appeared in the journal Science Advances, was led by Saied Mighani, an experimental rock physicist with MIT’s Department of Earth, Atmospheric, and Planetary Sciences. He was joined by members of the Berkeley Geochronology Center at UC Berkeley and the China University of Geosciences, with additional support provided by famed EAPS professor, Dr. Benjamin Weiss.

[embedded content]

To recap, Earth’s magnetic field is essential to life as we know it. When incoming solar wind particles reach Earth, they are deflected by this field and form a bow shock in front of Earth and magnetotail behind it. The remaining particles are deposited on the magnetic poles where they interact with our atmosphere, which causes the Aurorae seen in the far northern and southern hemispheres.

Were it not for this magnetic field, Earth’s atmosphere would have been slowly stripped away by solar wind over the course of billions of years and rendered a cold, dry place. This is believed to be what happened on Mars, where a once-thicker atmosphere was depleted between 4.2 and 3.7 billion years ago and all of the liquid water on its surface was either lost or froze as a result.

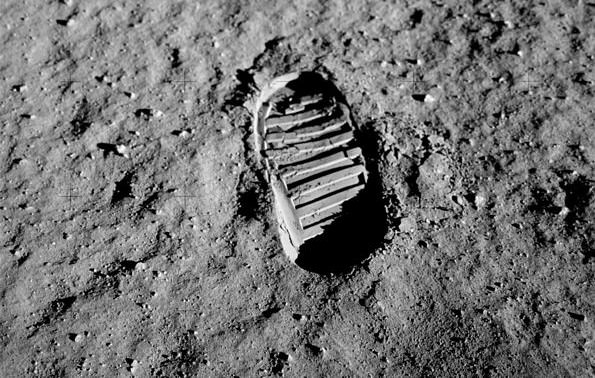
Over the years, Weiss’ group has helped demonstrate through the study of lunar rocks that roughly 4 billion years ago, the Moon also had a strong magnetic field of about 100 microteslas in strength (whereas Earth’sis around 50 microteslas today). In 2017, they studied samples collected by the Apollo astronauts that were dated to about 2.5 billion years ago and found a much weaker field (less than 10 microteslas).

In other words, the Moon’s magnetic field weakened by a factor of five between 4 and 2.5 billion years ago, then disappeared entirely about 1 billion years ago. At the time, Weiss and his colleagues theorized that perhaps there were two dynamo mechanisms in the Moon’s interior that were responsible for this change.

Measurements of lunar rocks have demonstrated that the ancient moon generated a dynamo magnetic field in its liquid metallic core (innermost red shell). Credit: Hernán Cañellas/Benjamin Weiss

In short, they argued that a first dynamo effect could have generated a much stronger magnetic field around 4 billion years ago. Then, 2.5 billion years ago, it was replaced by a second dynamo that was more long-lived but sustained a much weaker magnetic field. As Dr. Weiss explained in an MIT News release:

“There are several ideas for what mechanisms powered the lunar dynamo, and the question is, how do you figure out which one did it? It turns out all these power sources have different lifetimes. So if you could figure out when the dynamo turned off, then you could distinguish between the mechanisms that have been proposed for the lunar dynamo. That was the purpose of this new paper.”

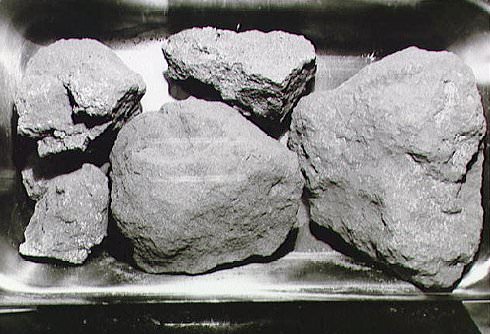
Until now, obtaining lunar rocks that are less than 3 billion years old has been a major challenge. The reason for this has to do with the fact that volcanic activity, which was common on the Moon 4 billion years ago, ceased roughly 3 billion years ago. Luckily, the MIT team was able to identify two samples of lunar rock obtained by the Apollo astronauts that were created by an impact 1 billion years ago.

While these rocks were melted by the impact and then resolidified, thus erasing their magnetic record in the process, the team was able to perform tests on them to reconstruct their magnetic signature. First, they analyzed the orientation of the rock’s electrons, which Weiss describes as “little compasses” since they would either align in the direction of an existing magnetic field or appear in random orientations in the absence of one.

Moon rocks from the Apollo 11 mission. Credit: NASA

In both samples, the team observed the latter, which suggested that the rocks formed in an extremely weak magnetic field of no more than 0.1 microteslas (possibly none at all). This was followed by a radiometric dating technique that was adapted for this study by Weiss and David L. Shuster (a Berkeley Geochronology Center researcher and co-author of the study). These results confirmed that the rocks were indeed 1 billion years old.

Finally, the team conducted heat tests on the samples to determine if they could provide a good magnetic record at the time of the impact. This consisted of placing both samples in an oven and exposing them to the kinds of high temperatures that would have been created by an impact. As they cooled, they exposed them to an artificially-generated magnetic field in the laboratory and confirmed that they were able to record it.

These results confirm that the magnetic strength initially measured by the team (0.1 microteslas) is accurate and that by 1 billion years ago, the dynamo powering the Moon’s magnetic field had likely ended. As Weiss expressed:

“The magnetic field is this nebulous thing that pervades space, like an invisible force field. We’ve shown that the dynamo that produced the moon’s magnetic field died somewhere between 1.5 and 1 billion years ago, and seems to have been powered in an Earth-like way.”

Lunar footprint from the Apollo missions. Credit: NASA

As noted, this study also helps to resolve the debate surrounding what drove the lunar dynamo in its later stages. While multiple theories have been suggested, these new findings are consistent with the theory that core crystallization is responsible. Basically, this theory states that the Moon’s inner core crystallized over time, slowing the flow of electrically-charged fluid and arresting the dynamo.

Weiss suggests that prior to this, precession may have been responsible for powering a much stronger (but short-lived) dynamo which would have produced the strong magnetic field. This is consistent with the fact that 4 billion years ago, the Moon is thought to have orbited much closer to Earth. This would have resulted in Earth’s gravity having a far greater effect on the Moon, causing its mantle to wobble and stirring up activity in the core.

As the Moon slowly migrated away from Earth, the effect of precession decreased and the magnetic field-producing dynamo would weaken. By about 2.5 billion years ago, crystallization became the dominant mechanism by which the lunar dynamo continued, producing a weaker magnetic field that persisted until the outer core finally crystallized a billion years ago.

Studies like this could also help resolve the mystery of why planets like Venus and Mars lost their magnetic fields (contributing to cataclysmic climate change) and how Earth could lose its own someday. Considering its importance to habitability, a greater understanding of dynamos and magnetic fields could also help in the search for habitable exoplanets.

Further Reading: MIT News, Science Advances

Let’s block ads! (Why?)

728x90x4

Source link

Continue Reading

Science

"Hi, It's Me": NASA's Voyager 1 Phones Home From 15 Billion Miles Away – NDTV

Published

 on


<!–

–>

Launched in 1977, Voyager 1 was mankind’s first spacecraft to enter the interstellar medium

Washington, United States:

300x250x1

NASA’s Voyager 1 probe — the most distant man-made object in the universe — is returning usable information to ground control following months of spouting gibberish, the US space agency announced Monday.

The spaceship stopped sending readable data back to Earth on November 14, 2023, even though controllers could tell it was still receiving their commands.

In March, teams working at NASA’s Jet Propulsion Laboratory discovered that a single malfunctioning chip was to blame, and devised a clever coding fix that worked within the tight memory constraints of its 46-year-old computer system.

window._rrCode = window._rrCode || [];_rrCode.push(function() (function(v,d,o,ai)ai=d.createElement(“script”);ai.defer=true;ai.async=true;ai.src=v.location.protocol+o;d.head.appendChild(ai);)(window, document, “//a.vdo.ai/core/v-ndtv/vdo.ai.js”); );

“Voyager 1 spacecraft is returning usable data about the health and status of its onboard engineering systems,” the agency said.

“The next step is to enable the spacecraft to begin returning science data again.”

Launched in 1977, Voyager 1 was mankind’s first spacecraft to enter the interstellar medium, in 2012, and is currently more than 15 billion miles from Earth. Messages sent from Earth take about 22.5 hours to reach the spacecraft.

Its twin, Voyager 2, also left the solar system in 2018.

Both Voyager spacecraft carry “Golden Records” — 12-inch, gold-plated copper disks intended to convey the story of our world to extraterrestrials.

These include a map of our solar system, a piece of uranium that serves as a radioactive clock allowing recipients to date the spaceship’s launch, and symbolic instructions that convey how to play the record.

The contents of the record, selected for NASA by a committee chaired by legendary astronomer Carl Sagan, include encoded images of life on Earth, as well as music and sounds that can be played using an included stylus.

window._rrCode = window._rrCode || [];_rrCode.push(function(){ (function(d,t) var s=d.createElement(t); var s1=d.createElement(t); if (d.getElementById(‘jsw-init’)) return; s.setAttribute(‘id’,’jsw-init’); s.setAttribute(‘src’,’https://www.jiosaavn.com/embed/_s/embed.js?ver=’+Date.now()); s.onload=function()document.getElementById(‘jads’).style.display=’block’;s1.appendChild(d.createTextNode(‘JioSaavnEmbedWidget.init(a:”1″, q:”1″, embed_src:”https://www.jiosaavn.com/embed/playlist/85481065″,”dfp_medium” : “1”,partner_id: “ndtv”);’));d.body.appendChild(s1);; if (document.readyState === ‘complete’) d.body.appendChild(s); else if (document.readyState === ‘loading’) var interval = setInterval(function() if(document.readyState === ‘complete’) d.body.appendChild(s); clearInterval(interval); , 100); else window.onload = function() d.body.appendChild(s); ; )(document,’script’); });

Their power banks are expected to be depleted sometime after 2025. They will then continue to wander the Milky Way, potentially for eternity, in silence.

(Except for the headline, this story has not been edited by NDTV staff and is published from a syndicated feed.)

Adblock test (Why?)

728x90x4

Source link

Continue Reading

Science

West Antarctica's ice sheet was smaller thousands of years ago – here's why this matters today – The Conversation

Published

 on


As the climate warms and Antarctica’s glaciers and ice sheets melt, the resulting rise in sea level has the potential to displace hundreds of millions of people around the world by the end of this century.

A key uncertainty in how much and how fast the seas will rise lies in whether currently “stable” parts of the West Antarctic Ice Sheet can become “unstable”.

One such region is West Antarctica’s Siple Coast, where rivers of ice flow off the continent and drain into the ocean.

300x250x1
The Ross Ice Shelf holds back the flow of ice streams from West Antarctica’s Siple Coast.
Journal of Geophysical Research, CC BY-SA

This ice flow is slowed down by the Ross Ice Shelf, a floating mass of ice nearly the size of Spain, which holds back the land-based ice. Compared to other ice shelves in West Antarctica, the Ross Ice Shelf has little melting at its base because the ocean below it is very cold.

Although this region has been stable during the past few decades, recent research suggest this was not always the case. Radiocarbon dating of sediments from beneath the ice sheet tells us that it retreated hundreds of kilometres some 7,000 years ago, and then advanced again to its present position within the last 2,000 years.

Figuring out why this happened can help us better predict how the ice sheet will change in the future. In our new research, we test two main hypotheses.


Read more:
What an ocean hidden under Antarctic ice reveals about our planet’s future climate


Testing scenarios

Scientists have considered two possible explanations for this past ice sheet retreat and advance. The first is related to Earth’s crust below the ice sheet.

As an ice sheet shrinks, the change in ice mass causes the Earth’s crust to slowly uplift in response. At the same time, and counterintuitively, the sea level drops near the ice because of a weakening of the gravitational attraction between the ice sheet and the ocean water.

As the ice sheet thinned and retreated since the last ice age, crustal uplift and the fall in sea level in the region may have re-grounded floating ice, causing ice sheet advance.

A graphic showing how Earth's crust uplifts and sea level drops near the ice sheet as it loses mass.
Earth’s crust uplifts and sea level drops near the ice sheet as it loses mass.
AGU, CC BY-SA

The other hypothesis is that the ice sheet behaviour may be due to changes in the ocean. When the surface of the ocean freezes, forming sea ice, it expels salt into the water layers below. This cold briny water is heavier and mixes deep into the ocean, including under the Ross Ice Shelf. This blocks warm ocean currents from melting the ice.

A graphic showing the interaction between cold dense waters and warmer deep flows under the Ross Ice Shelf.
Top: Cold dense shelf water blocks warm circumpolar deep water from melting the ice. Bottom: Warm circumpolar deep water flows under the ice shelf, causing ice melting and retreat.
AGU, CC BY-SA

Seafloor sediments and ice cores tell us that this deep mixing was weaker in the past when the ice sheet was retreating. This means that warm ocean currents may have flowed underneath the ice shelf and melted the ice. Mixing increased when the ice sheet was advancing.

We test these two ideas with computer model simulations of ice sheet flow and Earth’s crustal and sea surface responses to changes in the ice sheet with varying ocean temperature.

Because the rate of crustal uplift depends on the viscosity (stickiness) of the underlying mantle, we ran simulations within ranges estimated for West Antarctica. A stickier mantle means slower crustal uplift as the ice sheet thins.

The simulations that best matched geological records had a stickier mantle and a warmer ocean as the ice sheet retreated. In these simulations, the ice sheet retreats more quickly as the ocean warms.

When the ocean cools, the simulated ice sheet readvances to its present-day position. This means that changes in ocean temperature best explain the past ice sheet behaviour, but the rate of crustal uplift also affects how sensitive the ice sheet is to the ocean.

Three polar tents set up on the Ross Ice Shelf.
Changes in ocean temperature best explain the retreat of West Antarctica’s ice sheet in the past.
Veronika Meduna, CC BY-SA

What this means for climate policy today

Much attention has been paid to recent studies that show glacial melting may be irreversible in some parts of West Antarctica, such as the Amundsen Sea embayment.

In the context of such studies, policy debates hinge on whether we should focus on adapting to rising seas rather than cutting greenhouse gas emissions. If the ice sheet is already melting, are we too late for mitigation?


Read more:
We can still prevent the collapse of the West Antarctic ice sheet – if we act fast to keep future warming in check


Our study suggests it is premature to give up on mitigation.

Global climate models run under high-emissions scenarios show less sea ice formation and deep ocean mixing. This could lead to the same cold-to-warm ocean switch that caused extensive ice sheet retreat thousands of years ago.

For West Antarctica’s Siple Coast, it is better if we prevent this ocean warming from occurring in the first place, which is still possible if we choose a low-emissions future.

Adblock test (Why?)

728x90x4

Source link

Continue Reading

Science

NASA's Voyager 1 resumes sending engineering updates to Earth – Phys.org

Published

 on


NASA’s Voyager 1 spacecraft is depicted in this artist’s concept traveling through interstellar space, or the space between stars, which it entered in 2012. Credit: NASA/JPL-Caltech

For the first time since November, NASA’s Voyager 1 spacecraft is returning usable data about the health and status of its onboard engineering systems. The next step is to enable the spacecraft to begin returning science data again. The probe and its twin, Voyager 2, are the only spacecraft to ever fly in interstellar space (the space between stars).

Voyager 1 stopped sending readable science and engineering data back to Earth on Nov. 14, 2023, even though mission controllers could tell the was still receiving their commands and otherwise operating normally. In March, the Voyager engineering team at NASA’s Jet Propulsion Laboratory in Southern California confirmed that the issue was tied to one of the spacecraft’s three onboard computers, called the flight data subsystem (FDS). The FDS is responsible for packaging the science and engineering data before it’s sent to Earth.

300x250x1

The team discovered that a responsible for storing a portion of the FDS memory—including some of the FDS computer’s software code—isn’t working. The loss of that code rendered the science and engineering data unusable. Unable to repair the chip, the team decided to place the affected code elsewhere in the FDS memory. But no single location is large enough to hold the section of code in its entirety.

So they devised a plan to divide affected the code into sections and store those sections in different places in the FDS. To make this plan work, they also needed to adjust those code sections to ensure, for example, that they all still function as a whole. Any references to the location of that code in other parts of the FDS memory needed to be updated as well.

NASA’s Voyager 1 resumes sending engineering updates to Earth
After receiving data about the health and status of Voyager 1 for the first time in five months, members of the Voyager flight team celebrate in a conference room at NASA’s Jet Propulsion Laboratory on April 20. Credit: NASA/JPL-Caltech

The team started by singling out the responsible for packaging the spacecraft’s engineering data. They sent it to its new location in the FDS memory on April 18. A radio signal takes about 22.5 hours to reach Voyager 1, which is over 15 billion miles (24 billion kilometers) from Earth, and another 22.5 hours for a signal to come back to Earth. When the mission flight team heard back from the spacecraft on April 20, they saw that the modification had worked: For the first time in five months, they have been able to check the health and status of the spacecraft.

During the coming weeks, the team will relocate and adjust the other affected portions of the FDS software. These include the portions that will start returning science data.

Voyager 2 continues to operate normally. Launched over 46 years ago, the twin Voyager spacecraft are the longest-running and most distant spacecraft in history. Before the start of their interstellar exploration, both probes flew by Saturn and Jupiter, and Voyager 2 flew by Uranus and Neptune.

Provided by
NASA

Citation:
NASA’s Voyager 1 resumes sending engineering updates to Earth (2024, April 22)
retrieved 22 April 2024
from https://phys.org/news/2024-04-nasa-voyager-resumes-earth.html

This document is subject to copyright. Apart from any fair dealing for the purpose of private study or research, no
part may be reproduced without the written permission. The content is provided for information purposes only.

Adblock test (Why?)

728x90x4

Source link

Continue Reading

Trending