Science
The Northern Lights (Aurora Borealis) Explained


|
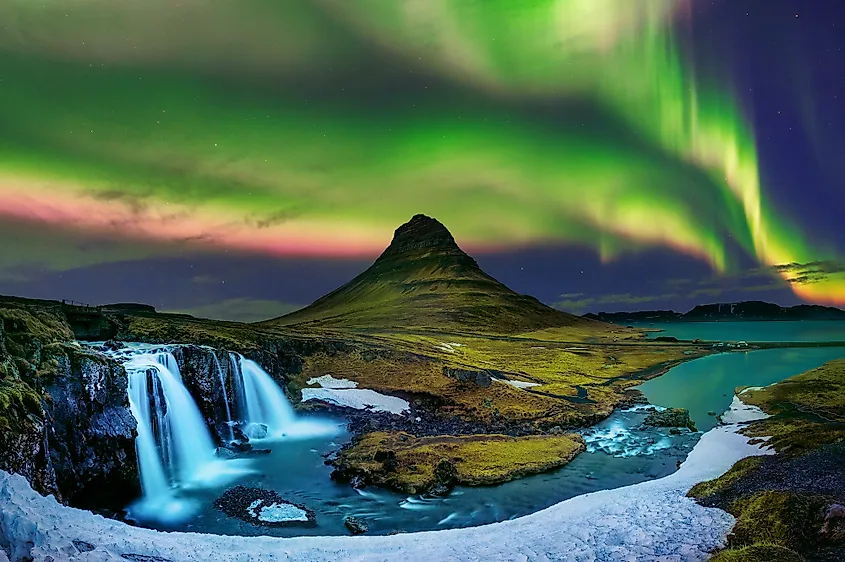
If you live far enough north or south on planet Earth, you may be lucky enough to see the northern/southern lights (aurora borealis/aurora australis). You’ll likely be starstruck by these dazzling light and color displays if you’re fortunate enough to find yourself outside on a clear night while the aurora borealis occur. These dancing bands of light are indeed one of nature’s most stunning sights. What are they, and how do they form? The answers to these questions help us understand the Earth’s relationship with the Sun. They also provide insight into how the interior of our world and its atmosphere interact with the Sun’s energy.
How The Aurora Are Produced
The Sun is the nearest star to us at 93 million miles. Despite that vast distance, the sheer energy from the Sun is powerful enough to warm our world and sustain all life. The Sun is constantly emitting a flow of radiation called the solar wind. The solar wind is composed of countless particles that have been charged with high amounts of energy from the Sun. These high-energy particles are deadly to life on Earth and can damage the very structure of our DNA. Thankfully, the Earth has developed natural barriers that protect us from solar wind. The Earth’s magnetic field is our primary form of defense against the solar wind. This field is produced due to Earth having an iron core that spins. Iron can conduct electricity, and as it turns, the moving electric charge creates a magnetic field. The magnetic field produced by the Earth’s core moves outwards and forms a web-like structure that encompasses our world. When solar wind encounters the Earth’s magnetic field, it is redirected away from our world. Without a magnetic field, the solar wind would slowly erode our atmosphere until nothing but a thin veil of air remains.


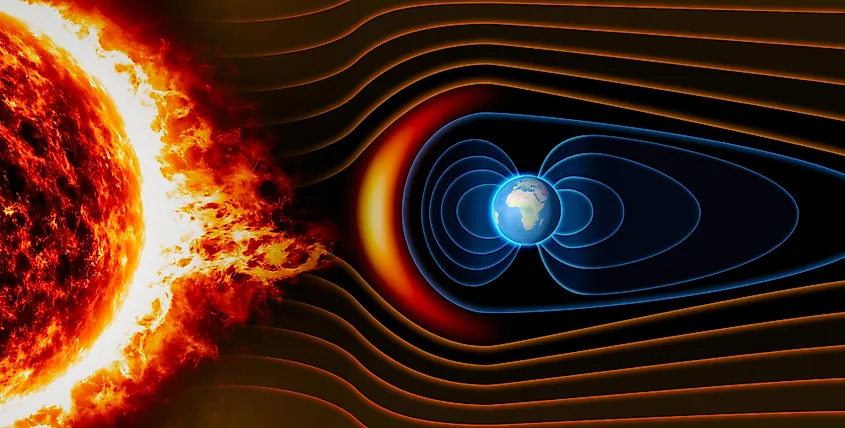
However, not all of the particles in the solar wind are redirected away. Instead, the magnetic field redirects some charged particles towards the Earth’s poles. Even when the solar wind manages to reach our world, life is still protected by an ozone layer. However, there are two large holes in the Earth’s ozone, one located at either pole. When charged particles are redirected towards the North and South Poles, they interact with the atoms in our atmosphere. The amount of energy in the solar wind causes some of the atoms in the Earth’s atmosphere to lose their electrons, a process called ionization. By ionizing particles in our atmosphere, the solar wind causes them to release light beams at high energy. The aurora are simply ionized atoms in our atmosphere that have interacted with charged particles from the Sun, causing them to glow and move through the air.
The Many Colors Of The Aurora


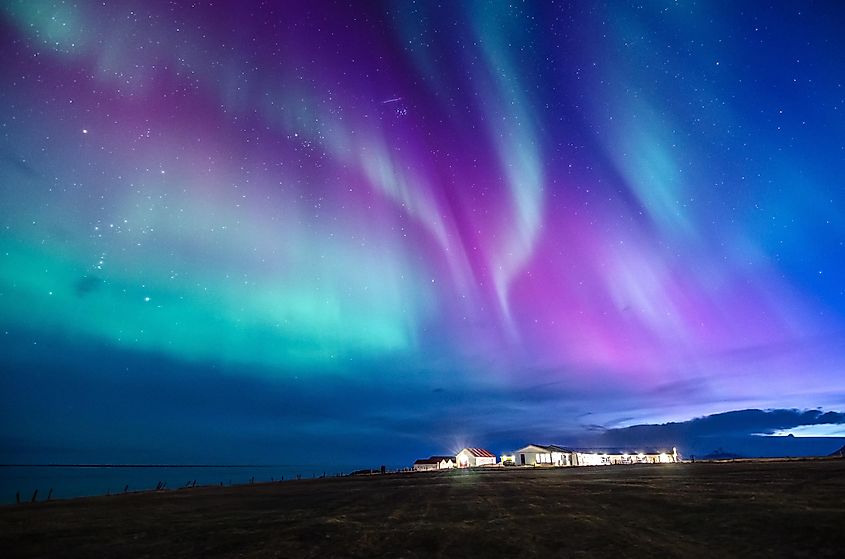
Although the aurora are generally green, they can come in a multitude of different colors. The color of the aurora is determined by the atoms that are being ionized along and the altitude at which this is happening. Since oxygen and nitrogen are the most abundant chemicals in the Earth’s atmosphere, the colors of the aurora are determined by how these two chemicals interact with the solar wind. When oxygen is ionized at a high altitude, the aurora glow red. At a lower altitude, ionized oxygen is green. The reason why the same chemical can give off two different colors has to do with the fact that at higher altitudes, the density of oxygen is far lower than at lower altitudes. The high altitude allows the solar wind to ionize oxygen at a higher frequency and produce a red glow. Likewise, at lower altitudes the frequency at which the solar wind interacts with oxygen is lower and the product is green light. In addition to red and green, the aurora can be blue or purple. If you happen to see these two colors, it means that nitrogen is being ionized in the atmosphere. The process by which the aurora form and produce their extraordinary colors only adds to their beauty and complexity.
Science
Joint NASA, CNES Water-Tracking Satellite Reveals First Stunning Views – Space Ref


This visualization shows water features on New York’s Long Island – shown as bright pink splotches. Purple, yellow, green, and dark blue shades represent different land elevations, while the surrounding ocean is a lighter blue. The data was collected on Jan. 21, 2023, by SWOT’s KaRIn instrument. Credit: NASA/JPL-Caltech
The Surface Water and Ocean Topography mission offers the first taste of the detailed perspectives of Earth’s surface water that its cutting-edge instruments will be able to capture.
The international Surface Water and Ocean Topography (SWOT) mission – led by NASA and the French space agency Centre National d’Études Spatiales (CNES) – has sent back some of its first glimpses of water on the planet’s surface, showing ocean currents like the Gulf Stream in unprecedented detail. SWOT is also capturing views of freshwater features such as lakes, rivers, and other water bodies down to about 300 feet (100 meters) wide.
The satellite will measure the elevation of nearly all the water on Earth’s surface and provide one of the most comprehensive surveys yet of our planet’s surface water. SWOT’s measurements of freshwater bodies and the ocean will provide insights into how the ocean influences climate change and the water cycle; how a warming world affects water storage in lakes, rivers, and reservoirs; and how communities can better manage their water resources and prepare for floods and other disasters.
“SWOT’s advanced imagery will empower researchers and advance the way we manage fresh water and the effects of sea level rise across the globe,” said NASA Administrator Bill Nelson. “Water is one of our planet’s most important resources – and it’s proven to be vulnerable to the impacts of climate change. SWOT will provide critical information that communities can use to prepare for the impacts of a warming climate.”
A Whole New View
As seen in these early images, on Jan. 21, 2023, SWOT measured sea level in a part of the Gulf Stream off the coast of North Carolina and Virginia. The two antennas of SWOT’s Ka-band Radar Interferometer (KaRIn) instrument acquired data that was mapped as a pair of wide, colored strips spanning a total of 75 miles (120 kilometers) across. Red and orange areas in the images represent sea levels that are higher than the global average, while the shades of blue represent sea levels that are lower than average.
For comparison, the new data is shown alongside sea surface height data taken by space-based instruments called altimeters. The instruments – widely used to measure sea level – also bounce radar signals off of Earth’s surface to collect their measurements. But traditional altimeters are able to look only at a narrow beam of Earth directly beneath them, unlike KaRIn’s two wide-swath strips that observe sea level as a two-dimensional map.
The spatial resolution of SWOT ocean measurements is 10 times greater than the composite of sea surface height data gathered over the same area by seven other satellites: Sentinel-6 Michael Freilich, Jason-3, Sentinel-3A and 3B, Cryosat-2, Altika, and Hai Yang 2B. The composite image was created using information from the Copernicus Marine Service of ESA (European Space Agency) and shows the same day as the SWOT data.
KaRIn also measured the elevation of water features on Long Island – shown as bright pink splotches nestled within the landscape. (Purple, yellow, green, and blue shades represent different land elevations.)
“Our ability to measure freshwater resources on a global scale through satellite data is of prime importance as we seek to adjust to a changing climate,” said CNES Chairman and CEO Philippe Baptiste. “In this respect, the first views from SWOT give us a clearer picture than ever before. These data will prove highly valuable for the international scientific community in the fields of hydrology, oceanography, and coastal studies.”
This initial inland image is a tantalizing indication of how SWOT can measure details of smaller lakes, ponds, and rivers in ways that satellites could not before. Such data will be used to produce an extraordinary accounting of the freshwater on Earth’s surface in ways useful to researchers, policymakers, and water resource managers.
“The KaRIn instrument took years to develop and build, and it will collect information on bodies of water across the globe – data that will be freely and openly available to everybody who needs it,” said Parag Vaze, SWOT project manager at NASA’s Jet Propulsion Laboratory in Southern California.
More About the Mission
Launched on Dec. 16, 2022, from Vandenberg Space Force Base in central California, SWOT is now in a period of commissioning, calibration, and validation. Engineers are checking out the performance of the satellite’s systems and science instruments before the planned start of science operations in summer 2023.
The data for these first images was collected by SWOT’s KaRIn instrument, the scientific heart of the satellite. KaRIn has one antenna at each end of a boom that’s 33 feet (10 meters) long. This enables the instrument to look off to either side of a center line directly below the satellite as it bounces microwave signals off Earth’s surface. The returning radar signals arrive at each antenna slightly out of sync, or phase, from one another. When these signals are combined with other information about the antennas and the satellite’s altitude, scientists will be able to map the height of water on Earth’s surface with never-before-seen clarity. KaRIn encountered an issue earlier this year with one of its subsystems; engineers have now resolved the situation, and the instrument is up and running.
SWOT was jointly developed by NASA and CNES, with contributions from the Canadian Space Agency (CSA) and the UK Space Agency. JPL, which is managed for NASA by Caltech in Pasadena, California, leads the U.S. component of the project. For the flight system payload, NASA provided the KaRIn instrument, a GPS science receiver, a laser retroreflector, a two-beam microwave radiometer, and NASA instrument operations. CNES provided the Doppler Orbitography and Radioposition Integrated by Satellite (DORIS) system, the dual frequency Poseidon altimeter (developed by Thales Alenia Space), the KaRIn radio-frequency subsystem (together with Thales Alenia Space and with support from the UK Space Agency), the satellite platform, and ground operations. CSA provided the KaRIn high-power transmitter assembly. NASA provided the launch vehicle and the agency’s Launch Services Program, based at Kennedy Space Center, managed the associated launch services.
To learn more about SWOT, visit: https://swot.jpl.nasa.gov/
Science
Severe solar storm hits Earth, strongest in past 6 years – Indiatimes.com


The Earth witnessed a powerful solar storm in nearly six years, causing auroras all over the US, the National Oceanic and Atmospheric Administration (NOAA) said. NOAA had earlier announced moderate G2 storm and G3 conditions between March 23 and 25, but updated it to G4. A severe G4 storm can affect the power grid system with possible widespread voltage control problems; and spacecraft operations with increased possibility of surface charging, and atmospheric drag risk on Low Earth Orbiting (LEO) satellites.
Science
Parade of five planets on display in B.C. skies Tuesday evening


|
Five of the sun’s eight major planets will be lined up on the western horizon this Tuesday just after sunset.
The astronomical delight will comprise Mercury, Venus, Mars, Jupiter and Uranus — all in a visible line from the horizon to the crescent moon.
NASA astronomer Bill Cooke says the best way to get a glimpse is to stand somewhere with a clear view of the western horizon.
The planets will stretch from the horizon to halfway up the night sky.
Mercury and Jupiter (the first and fifth planets from the sun) will dip below the horizon around 30 minutes after sunset, that is 7:37 p.m. on Tuesday.
The five-planet spread can be seen anywhere on Earth.
Venus, Mars and Jupiter will be the brightest, particularly Venus, and Mars will be closest to the moon. Mercury and Uranus will be the dimmest, so a set of binoculars will be useful.
Uranus is the rarest seen of the planetary lineup.


-
Investment16 hours ago
First Republic Bank Stock: Why I Am Sticking To My Investment (NYSE:FRC)
-
Investment17 hours ago
The A.I. boom could also give a boost to these investing trends. How to play it
-
News23 hours ago
Biden visit: Trump calls Canada-U.S. deals ‘horrible’
-
Business16 hours ago
Thousands without power after Ontario windstorm
-
Sports22 hours ago
Despite 17 birdies, Rory McIlroy needs two trips to ‘friendly’ No. 18
-
News19 hours ago
Canada is set for its largest alcohol tax increase yet. Here’s what to know
-
Health18 hours ago
HPHA to close COVID, cold and flu clinics
-
Media16 hours ago
Utah is first US state to limit teen social media access