The 2010s saw living standards in the UK grow at their slowest rate since the second world war, even though the economy enjoyed uninterrupted expansion and employment grew at a record rate.
The jobs bonanza — and the economy’s performance as a whole — was undermined by weak productivity, which grew at its slowest level in 60 years. Economists warn this is the key challenge facing Boris Johnson’s government as the new decade begins.
Here are four key charts that illustrate the UK economy in the 2010s.
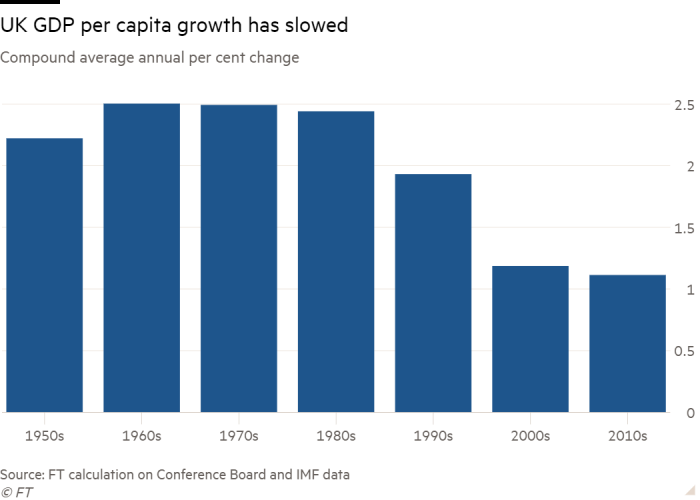
Slow growth in living standards
Growth in per capita output is the biggest driver of increased living standards, but in the UK over the past 10 years it averaged less than half the rate of the postwar period.
According to calculations based on IMF estimates, UK per capita output grew at an annual average of 1.1 per cent in the last decade. This is slightly below the rate of the 2000s, when output was dragged down by the financial crisis.
Uninterrupted but sluggish economic growth
The UK economy expanded every single year in the last decade — one of only three contraction-free decades since the 1700s (the others were the 1950s and the 1960s), according to data from the Bank of England. The 2010s also marked the first decade since the second world war without a recession — defined as two quarters of negative growth.
However, while the UK enjoyed uninterrupted economic growth, it was also slow, adding up to an annual average of 1.8 per cent. This is about the same rate as in the previous decade, when average growth was depressed by a 4.2 per cent contraction due to the financial crisis in 2009. The rate of GDP growth in the 2010s was also far below the overall average of 2.4 per cent in the 40 years to 1990.
However, Samuel Tombs, chief UK economist at Pantheon Macroeconomics, said: “The economy’s resilience is remarkable in light of the scale of fiscal tightening since 2010, the eurozone’s debt crisis and the shock of the Brexit vote. The 2020s might be choppier.”
A decade of jobs growth
The UK experienced a jobs boom in the 2010s, with employment growing at the fastest rate of any decade since at least the 1950s.
IMF estimates show that in 2019 there were about 3.7m additional workers than in 2009, corresponding to an annual average growth rate of 1.2 per cent. This is the fastest increase of any decade since 1950.
Along with the increase in jobs, the number of hours worked also rose at the fastest rate of any of the previous six decades.
But economists warn that the employment boom hides poor quality jobs and is unlikely to be sustainable.
“Superficially, employment figures look good,” said Andrew Simms, co-director of the New Weather Institute at the University of Sussex. “But these hide a range of dynamics: the precarious nature of the current jobs market, including insecure contracts and in-work poverty.” Large regional disparities were also apparent, he said.
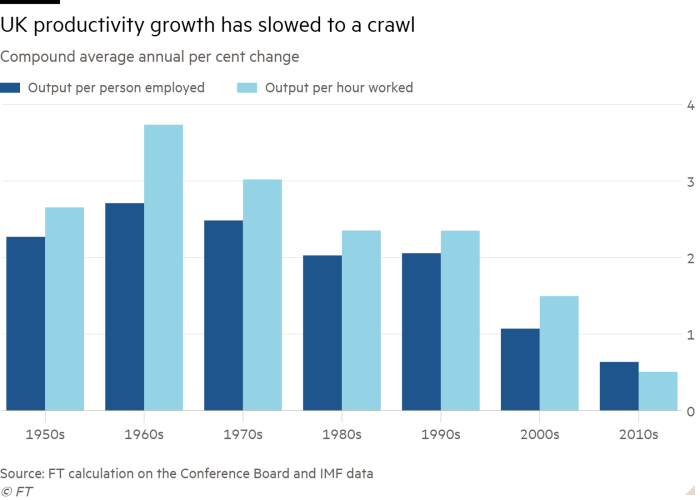
Productivity growth slowed to a crawl
The UK’s sluggish economic expansion in the 2010s was largely the result of more people being in work, rather than greater efficiency, resulting in the slowest productivity growth of any decade since the second world war.
According to the IMF forecast for 2019, the output per person employed in the UK grew at an annual rate of 0.6 per cent in the 2010s, compared with 1.1 per cent in the previous decade and more than 2 per cent in any other post world war decade.
Poor productivity growth undermines employers’ ability to pay there workers more, which would allow living standards to rise.
“For a sustainable expansion we need productivity growth to return,” said Richard Davies, fellow at the London School of Economics. “Here the story will not change in 2020 and the most important economic puzzle of our time — the flatlining of output per hour for over a decade — will remain the government’s key challenge.”
TORONTO – Strength in the base metal and technology sectors helped Canada’s main stock index gain almost 100 points on Friday, while U.S. stock markets also climbed higher.
The S&P/TSX composite index closed up 93.51 points at 23,568.65.
In New York, the Dow Jones industrial average was up 297.01 points at 41,393.78. The S&P 500 index was up 30.26 points at 5,626.02, while the Nasdaq composite was up 114.30 points at 17,683.98.
The Canadian dollar traded for 73.61 cents US compared with 73.58 cents US on Thursday.
The October crude oil contract was down 32 cents at US$68.65 per barrel and the October natural gas contract was down five cents at US$2.31 per mmBTU.
The December gold contract was up US$30.10 at US$2,610.70 an ounce and the December copper contract was up four cents US$4.24 a pound.
This report by The Canadian Press was first published Sept. 13, 2024.
OTTAWA – Statistics Canada says wholesale sales, excluding petroleum, petroleum products, and other hydrocarbons and excluding oilseed and grain, rose 0.4 per cent to $82.7 billion in July.
The increase came as sales in the miscellaneous subsector gained three per cent to reach $10.5 billion in July, helped by strength in the agriculture supplies industry group, which rose 9.2 per cent.
The food, beverage and tobacco subsector added 1.7 per cent to total $15 billion in July.
The personal and household goods subsector fell 2.5 per cent to $12.1 billion.
In volume terms, overall wholesale sales rose 0.5 per cent in July.
Statistics Canada started including oilseed and grain as well as the petroleum and petroleum products subsector as part of wholesale trade last year, but is excluding the data from monthly analysis until there is enough historical data.
This report by The Canadian Press was first published Sept. 13, 2024.
TORONTO – Canada’s main stock index was up more than 150 points in late-morning trading, helped by strength in the base metal and energy sectors, while U.S. stock markets were mixed.
The S&P/TSX composite index was up 172.18 points at 23,383.35.
In New York, the Dow Jones industrial average was down 34.99 points at 40,826.72. The S&P 500 index was up 10.56 points at 5,564.69, while the Nasdaq composite was up 74.84 points at 17,470.37.
The Canadian dollar traded for 73.55 cents US compared with 73.59 cents US on Wednesday.
The October crude oil contract was up $2.00 at US$69.31 per barrel and the October natural gas contract was up five cents at US$2.32 per mmBTU.
The December gold contract was up US$40.00 at US$2,582.40 an ounce and the December copper contract was up six cents at US$4.20 a pound.
This report by The Canadian Press was first published Sept. 12, 2024.