adplus-dvertising
Connect with us

Business

The Daily — Gross domestic product, income and expenditure, second quarter 2024 – Statistique Canada

Published

 on

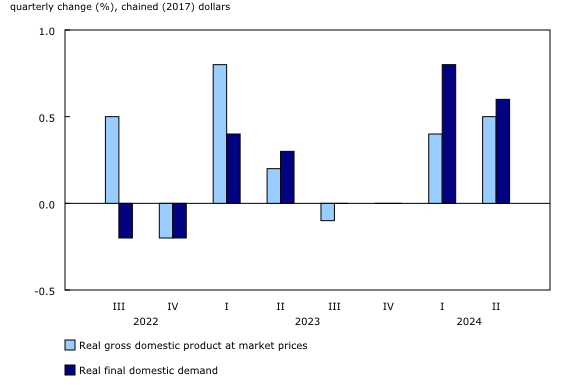
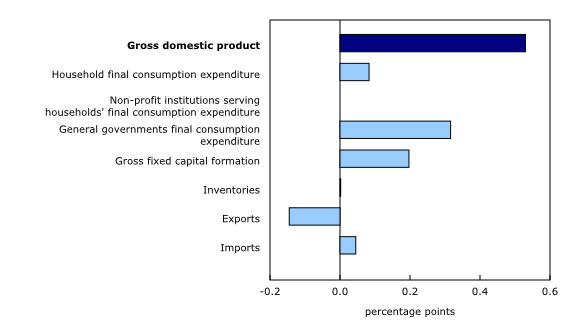
Real gross domestic product (GDP) increased 0.5% in the second quarter after rising 0.4% in the first quarter. Higher government final consumption expenditures, business investment in engineering structures and machinery and equipment, and household spending on services in the second quarter were moderated by declines in exports, residential construction and household spending on goods.

On a per capita basis, GDP fell 0.1% in the second quarter – the fifth consecutive quarterly decline.

Chart 1 Chart 1: Real gross domestic product and final domestic demand
Real gross domestic product and final domestic demand

Chart 1: Real gross domestic product and final domestic demand

Chart 2 Chart 2: Contributions to percentage change in real gross domestic product, second quarter of 2024
Contributions to percentage change in real gross domestic product, second quarter of 2024

Chart 2: Contributions to percentage change in real gross domestic product, second quarter of 2024

Government spending rises on higher wages

Government expenditures rose 1.5% in the second quarter, as there were increases in compensation of employees, which is an expense for governments, and hours worked across all levels of government. Purchases of goods and services in the federal as well as in provincial and territorial governments also rebounded in the second quarter from a decline in the first quarter.

Higher business investment in machinery and equipment and engineering structures

Business spending on machinery and equipment increased 6.5% in the second quarter, led by higher spending on aircraft and other transportation equipment and parts. This coincided with increased imports of aircraft and ships.

Business investment in non-residential structures increased 0.5% in the second quarter due to higher spending on engineering structures, primarily in the oil and gas sector. Business investment in non-residential building construction fell 1.2%, as investment in commercial and industrial structures declined.

Business spending on intellectual property products edged up 0.3% in the second quarter, mainly due to increased spending on mineral exploration and evaluation (+4.5%).

Household spending slows in second quarter

Growth in household spending slowed to 0.2% in the second quarter after rising 0.9% in the first quarter. Higher expenditures for rental fees for housing, food and electricity led the increase in the second quarter. Meanwhile, fewer purchases of new trucks, vans and sport utility vehicles as well as reduced expenditures by Canadians abroad tempered overall growth.

Population growth outpaced the increase in household spending in the second quarter, and, as a result, per capita household expenditures fell 0.4% after rising 0.3% in the first quarter.

Chart 3 Chart 3: Change in total and per capita real household final consumption expenditure
Change in total and per capita real household final consumption expenditure

Chart 3: Change in total and per capita real household final consumption expenditure

Weakening net trade, as exports decline more than imports

Exports of goods and services fell 0.4% in the second quarter after rising 0.5% in the first quarter. In the second quarter, lower exports of unwrought gold, silver, and platinum group metals as well as of passenger cars and light trucks and refined petroleum energy products were moderated by higher exports of crude oil and bitumen.

Imports of goods and services edged down 0.1% in the second quarter after recording no change in the first quarter. Lower imports of industrial machinery, equipment and parts, commercial services and refined petroleum energy products led the decrease in the second quarter, while higher imports of passenger cars and light trucks tempered the overall decline.

Chart 4 Chart 4: Volumes of exports and imports
Volumes of exports and imports

Chart 4: Volumes of exports and imports

Residential construction continues to decline, falling in eight of the last nine quarters

Housing investment was down 1.9% in the second quarter, the largest decline since the first quarter of 2023. The decrease in the second quarter of 2024 was driven by lower investment in new construction (-1.6%), as work put in place for single-family dwellings and apartments fell, primarily in Ontario. Renovations fell 2.6%, and ownership transfer costs, which represent the resale market, declined 1.1%, led by less activity in Ontario.

Chart 5 Chart 5: Housing investment
Housing investment

Chart 5: Housing investment

Gross domestic product deflator up on higher prices for services

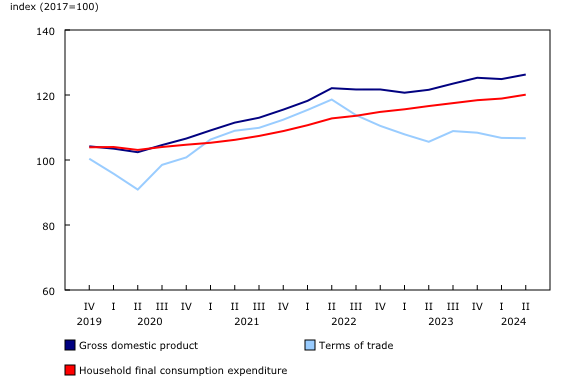
The GDP deflator rose 1.1% in the second quarter, led by higher prices for household consumption of services.

The ratio of the price of exports to the price of imports—the terms of trade—fell 0.1% in the second quarter as growth in import prices outpaced the growth in export prices.

Chart 6 Chart 6: Gross domestic product price indexes, selected components
Gross domestic product price indexes, selected components

Chart 6: Gross domestic product price indexes, selected components

Compensation of employees rises

Compensation of employees rose 1.6% in the second quarter after increasing 1.5% in the first quarter. Growth in the second quarter was led by increased wages in health care and social assistance, educational services and finance and insurance. Retroactive payments associated with arbitration decisions for members of the Ontario Secondary School Teachers’ Federation and Elementary Teachers’ Federation of Ontario were a large contributor to the wage growth in educational services. Among all industries, wages and salaries in mining and oil and gas extraction (+5.6%) had the strongest growth in the second quarter.

Map 1 Thumbnail for map 1: Compensation of employees, quarter-to-quarter % change, seasonally adjusted data
Compensation of employees, quarter-to-quarter % change, seasonally adjusted data

Thumbnail for map 1: Compensation of employees, quarter-to-quarter % change, seasonally adjusted data

Household saving rate up on higher wages

The household savings rate reached 7.2% in the second quarter, as gains in disposable income outpaced increases in nominal consumption expenditure. Disposable income gains were mainly from wages and salaries.

Growth in investment income slowed in the second quarter, rising 2.8%, mainly on higher interest received and dividends. At the same time, household property income payments, comprised of mortgage and non-mortgage interest expenses, rose at a faster pace (+5.7%) compared with the first quarter (+4.1%). The Bank of Canada announced a cut to the policy interest rate at the beginning of June, followed by a further cut in July; however, many mortgage borrowers are still facing relatively higher renewal costs following the rate hikes that began in early 2022.

Higher income households tend to earn greater share of investment income than lower income households, while lower income households tend to have interest expenses that represent a greater share of their disposable income.

Corporate incomes

In the second quarter of 2024, total corporate incomes (i.e., gross operating surplus) rose 3.1% after falling 5.6% in the first quarter. In the second quarter, the operating surplus of non-financial corporations rose 3.1%, with gains in the oil and gas extraction sector, while financial corporations surplus rose 2.9%.

Continue Reading

Business

Telus prioritizing ‘most important customers,’ avoiding ‘unprofitable’ offers: CFO

Published

 on


Telus Corp. says it is avoiding offering “unprofitable” discounts as fierce competition in the Canadian telecommunications sector shows no sign of slowing down.

The company said Friday it had fewer net new customers during its third quarter compared with the same time last year, as it copes with increasingly “aggressive marketing and promotional pricing” that is prompting more customers to switch providers.

Telus said it added 347,000 net new customers, down around 14.5 per cent compared with last year. The figure includes 130,000 mobile phone subscribers and 34,000 internet customers, down 30,000 and 3,000, respectively, year-over-year.

The company reported its mobile phone churn rate — a metric measuring subscribers who cancelled their services — was 1.09 per cent in the third quarter, up from 1.03 per cent in the third quarter of 2023. That included a postpaid mobile phone churn rate of 0.90 per cent in its latest quarter.

Telus said its focus is on customer retention through its “industry-leading service and network quality, along with successful promotions and bundled offerings.”

“The customers we have are the most important customers we can get,” said chief financial officer Doug French in an interview.

“We’ve, again, just continued to focus on what matters most to our customers, from a product and customer service perspective, while not loading unprofitable customers.”

Meanwhile, Telus reported its net income attributable to common shares more than doubled during its third quarter.

The telecommunications company said it earned $280 million, up 105.9 per cent from the same three-month period in 2023. Earnings per diluted share for the quarter ended Sept. 30 was 19 cents compared with nine cents a year earlier.

It reported adjusted net income was $413 million, up 10.7 per cent year-over-year from $373 million in the same quarter last year. Operating revenue and other income for the quarter was $5.1 billion, up 1.8 per cent from the previous year.

Mobile phone average revenue per user was $58.85 in the third quarter, a decrease of $2.09 or 3.4 per cent from a year ago. Telus said the drop was attributable to customers signing up for base rate plans with lower prices, along with a decline in overage and roaming revenues.

It said customers are increasingly adopting unlimited data and Canada-U.S. plans which provide higher and more stable ARPU on a monthly basis.

“In a tough operating environment and relative to peers, we view Q3 results that were in line to slightly better than forecast as the best of the bunch,” said RBC analyst Drew McReynolds in a note.

Scotiabank analyst Maher Yaghi added that “the telecom industry in Canada remains very challenging for all players, however, Telus has been able to face these pressures” and still deliver growth.

The Big 3 telecom providers — which also include Rogers Communications Inc. and BCE Inc. — have frequently stressed that the market has grown more competitive in recent years, especially after the closing of Quebecor Inc.’s purchase of Freedom Mobile in April 2023.

Hailed as a fourth national carrier, Quebecor has invested in enhancements to Freedom’s network while offering more affordable plans as part of a set of commitments it was mandated by Ottawa to agree to.

The cost of telephone services in September was down eight per cent compared with a year earlier, according to Statistics Canada’s most recent inflation report last month.

“I think competition has been and continues to be, I’d say, quite intense in Canada, and we’ve obviously had to just manage our business the way we see fit,” said French.

Asked how long that environment could last, he said that’s out of Telus’ hands.

“What I can control, though, is how we go to market and how we lead with our products,” he said.

“I think the conditions within the market will have to adjust accordingly over time. We’ve continued to focus on digitization, continued to bring our cost structure down to compete, irrespective of the price and the current market conditions.”

Still, Canada’s telecom regulator continues to warn providers about customers facing more charges on their cellphone and internet bills.

On Tuesday, CRTC vice-president of consumer, analytics and strategy Scott Hutton called on providers to ensure they clearly inform their customers of charges such as early cancellation fees.

That followed statements from the regulator in recent weeks cautioning against rising international roaming fees and “surprise” price increases being found on their bills.

Hutton said the CRTC plans to launch public consultations in the coming weeks that will focus “on ensuring that information is clear and consistent, making it easier to compare offers and switch services or providers.”

“The CRTC is concerned with recent trends, which suggest that Canadians may not be benefiting from the full protections of our codes,” he said.

“We will continue to monitor developments and will take further action if our codes are not being followed.”

French said any initiative to boost transparency is a step in the right direction.

“I can’t say we are perfect across the board, but what I can say is we are absolutely taking it under consideration and trying to be the best at communicating with our customers,” he said.

“I think everyone looking in the mirror would say there’s room for improvement.”

This report by The Canadian Press was first published Nov. 8, 2024.

Companies in this story: (TSX:T)

Source link

Continue Reading

Business

TC Energy cuts cost estimate for Southeast Gateway pipeline project in Mexico

Published

 on


CALGARY – TC Energy Corp. has lowered the estimated cost of its Southeast Gateway pipeline project in Mexico.

It says it now expects the project to cost between US$3.9 billion and US$4.1 billion compared with its original estimate of US$4.5 billion.

The change came as the company reported a third-quarter profit attributable to common shareholders of C$1.46 billion or $1.40 per share compared with a loss of C$197 million or 19 cents per share in the same quarter last year.

Revenue for the quarter ended Sept. 30 totalled C$4.08 billion, up from C$3.94 billion in the third quarter of 2023.

TC Energy says its comparable earnings for its latest quarter amounted to C$1.03 per share compared with C$1.00 per share a year earlier.

The average analyst estimate had been for a profit of 95 cents per share, according to LSEG Data & Analytics.

This report by The Canadian Press was first published Nov. 7, 2024.

Companies in this story: (TSX:TRP)

The Canadian Press. All rights reserved.

Source link

Continue Reading

Business

BCE reports Q3 loss on asset impairment charge, cuts revenue guidance

Published

 on


BCE Inc. reported a loss in its latest quarter as it recorded $2.11 billion in asset impairment charges, mainly related to Bell Media’s TV and radio properties.

The company says its net loss attributable to common shareholders amounted to $1.24 billion or $1.36 per share for the quarter ended Sept. 30 compared with a profit of $640 million or 70 cents per share a year earlier.

On an adjusted basis, BCE says it earned 75 cents per share in its latest quarter compared with an adjusted profit of 81 cents per share in the same quarter last year.

“Bell’s results for the third quarter demonstrate that we are disciplined in our pursuit of profitable growth in an intensely competitive environment,” BCE chief executive Mirko Bibic said in a statement.

“Our focus this quarter, and throughout 2024, has been to attract higher-margin subscribers and reduce costs to help offset short-term revenue impacts from sustained competitive pricing pressures, slow economic growth and a media advertising market that is in transition.”

Operating revenue for the quarter totalled $5.97 billion, down from $6.08 billion in its third quarter of 2023.

BCE also said it now expects its revenue for 2024 to fall about 1.5 per cent compared with earlier guidance for an increase of zero to four per cent.

The company says the change comes as it faces lower-than-anticipated wireless product revenue and sustained pressure on wireless prices.

BCE added 33,111 net postpaid mobile phone subscribers, down 76.8 per cent from the same period last year, which was the company’s second-best performance on the metric since 2010.

It says the drop was driven by higher customer churn — a measure of subscribers who cancelled their service — amid greater competitive activity and promotional offer intensity. BCE’s monthly churn rate for the category was 1.28 per cent, up from 1.1 per cent during its previous third quarter.

The company also saw 11.6 per cent fewer gross subscriber activations “due to more targeted promotional offers and mobile device discounting compared to last year.”

Bell’s wireless mobile phone average revenue per user was $58.26, down 3.4 per cent from $60.28 in the third quarter of the prior year.

This report by The Canadian Press was first published Nov. 7, 2024.

Companies in this story: (TSX:BCE)

The Canadian Press. All rights reserved.

Source link

Continue Reading

Trending