


Not a Bubble? The equity markets have been driven by momentum and speculation these past few weeks, not by underlying business fundamentals. We had GameStop
GME
, followed by Silver, then Pot stocks, and now SPACs, all driven by retail. PE ratios are in the top 1% of their historical range. Junk bond yields are at all-time-record low levels (sub 4%). In January, the worst stocks based on business fundamentals, significantly outperformed the overall market. This kind of behavior is what typically occurs at market tops. Doesn’t mean it can’t last longer. And we don’t know what event(s) will cause it to turn. But it is likely true the general market will have a difficult time moving much higher, as it has already discounted an economic rebound starting in Q3.
The Labor Market
The underlying health of the economy is, and always has been, measured by the health of the labor market. By that measure, we should worry. Market pundits, those on the sell side, point to the latest Congressional Budget Office (CBO) projections, which say GDP will return to pre-pandemic levels by mid-2021 as justification for nosebleed equity valuations. Government transfer payments grew 36% in 2020. Many collecting unemployment received more than they did in their old jobs. No doubt, the Biden $1.9 trillion stimulus will positively impact GDP. But that’s like maxing out one’s credit card for current living expenses without employment income, and pretending all is well. It isn’t!
In fact, those same CBO projections set included a couple of items conveniently ignored by the business media: 1) The economy won’t reach its potential GDP (i.e., there will be economic slack) until 2025, and 2) The actual number of employed people won’t reach pre-pandemic levels until sometime in 2024. That’s three years from now! The most optimistic reading of this CBO projection is that the employment market is “healing.”
Unfortunately, the most recent data do not support the “healing” hypothesis. It appears that there has been no “net” progress in the labor market since the end of September. The first chart and table show the weekly Initial Unemployment Claims (ICs) in the state-run programs for the past 51 weeks. Data for the week of February 6 show initial claims of 813K (Not Seasonally Adjusted (NSA) because the pandemic isn’t seasonal). That looked like an improvement from the 850K of the prior week – never mind that the worst reading recorded in the Great Recession was less than 700K and that spike was relatively short lived. The market ignored the fact that the initial reading for the prior week (January 30) was 816K (the 850K number was the result of an upward revision). So, the 813K reading should be looked at through the 816K lens, which means “no real progress!” Let’s be realistic: 813K, 850K, 816K – these are all government-generated data. Remember the expression: “Close enough for government work?” Are there really any substantive differences among those numbers? Of more importance, we are nearly a year into the pandemic and there are still more than 800K layoffs per week. And, that only counts those eligible for the state programs.
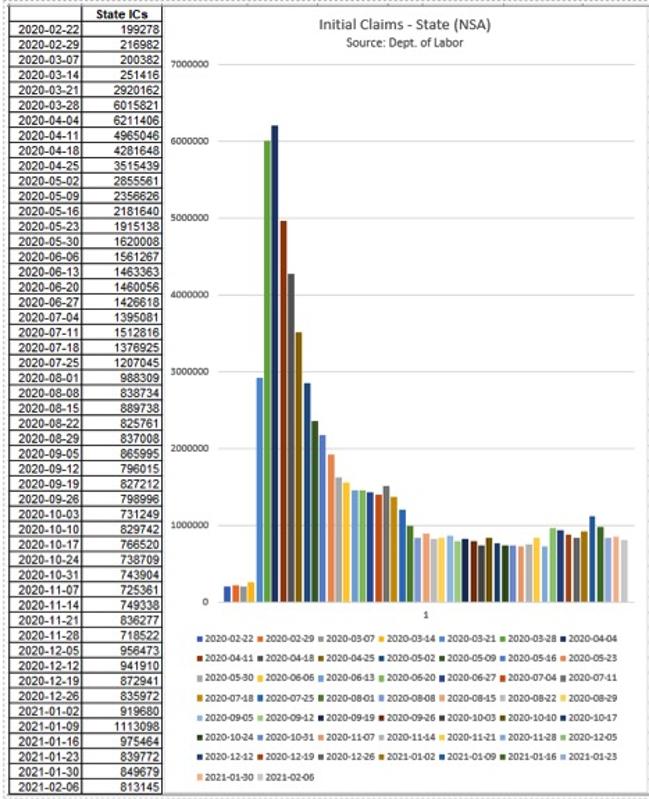
Initial Claims- State (NSA)
Universal Value Advisors
The next chart and table are even more concerning. The CARES Act last April established several programs (Pandemic Unemployment Assistance (PUA)) for those not eligible for the state unemployment plans. Those programs originally expired on December 26. They were renewed by the legislation at year’s end that doled out $600/taxpayer earning less than $75K in 2019. According to Yahoo Finance, paperwork issues resulted in delays for several states (did you really expect something different?).
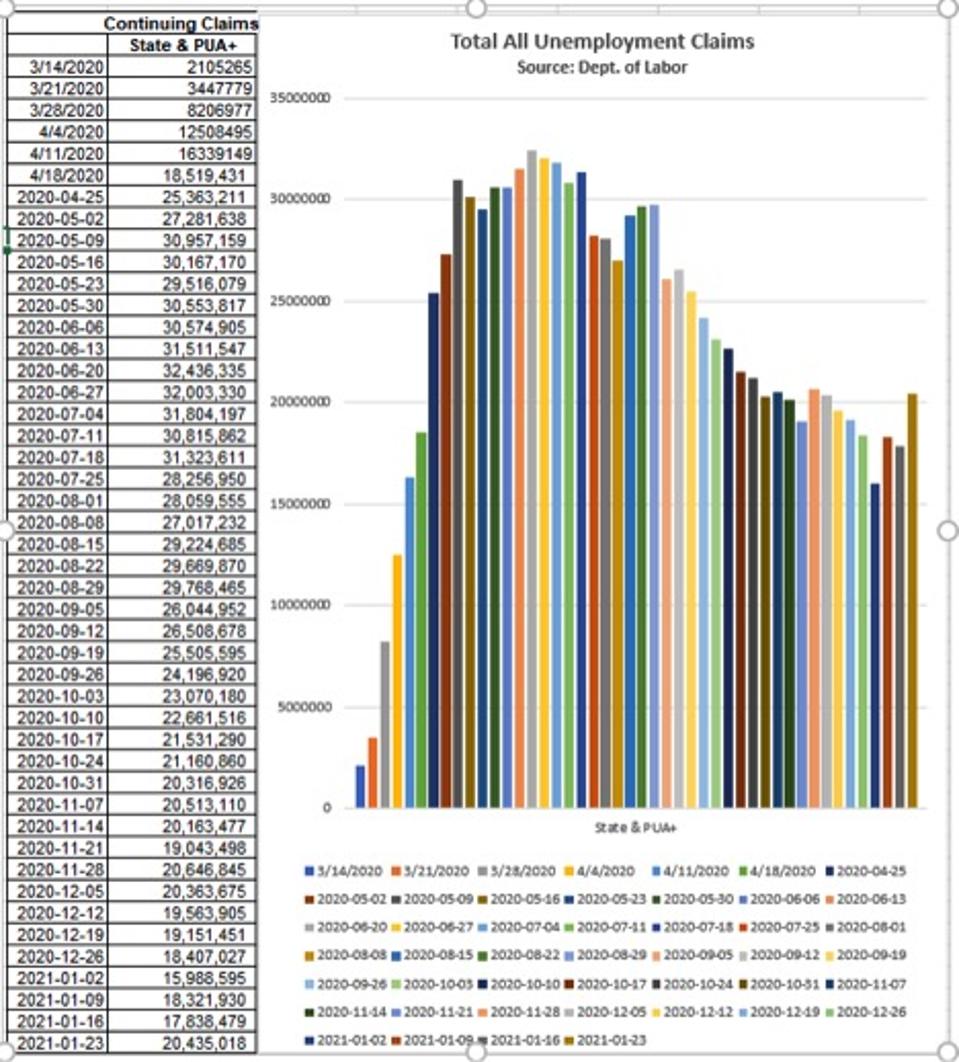
Total All Unemployment Claims
Universal Value Advisors
In this chart and table, which combines the state, PUA and other small programs, there is a significant dip in Continuing Claims (CCs) in early January. But, now, with the PUA programs re-established, we are right back to where we were at the end of October. That says to me, three months with no progress! The latest labor force level, as measured by the Bureau of Labor Statistics (BLS), was 160.1 million. Given the 20.4 million shown on the chart and in the table, that calculates to an unemployment rate of 12.7%. But wait, not long ago, the labor force level was north of 164 million. Four million have dropped out. If they are included as unemployed, the real unemployment rate is closer to 15%! Some hot economy, don’t you think?
Other High Frequency Data
Other data confirm what the labor market is telling us:
· The number of vacant housing units rose +14.9% in Q3 and +4.9% more in Q4 to more than 3 million units. Vacancy rates are above 7% in major U.S. cities. Manhattan vacancies are approaching 13,000 and rents there are down -19%. In Boston, they are down -22%.
· Retail sales were negative in October, November, and December. Johnson Redbook same store sales indicate that this negative run will likely continue.
· Mortgage applications for purchase have fallen in three of the past four weeks, and down -4.2% the week of February 5 versus the prior week. Refis are also down -4.2% for the same period. Housing has been holding up well, one of the few solid parts of the economy. And, while this negative data is new and very short in duration to this point, it could be worrisome.
As all the readers of this blog are well-aware, equity markets believe that, with the rollout of the vaccines and the $1.9 trillion stimulus on its way, “normal” will return by Q3 and the economy will “boom.” In my last few blogs, I have outlined why the “pent-up” demand narrative won’t play out as advertised (rising savings, unemployment levels, missed “services” aren’t made-up, demand for “stay at home” goods likely satiated). Besides what I outlined in those blogs, here are additional issues to ponder when thinking about the coming “boom:”
· At the end of 2020, 3.4 million mortgages were delinquent. Since the foreclosure moratorium began, consumers have used some of that mortgage payment money for consumption. While most mortgagors will likely tack the missed payments on the back end of the loan and extend its term, that mortgage money will no longer be available for consumption. Mortgagees have a much higher marginal propensity to consume (MPC) than do financial institutions or mortgagors.
· A huge 18% (10 million) of renters are behind on their rent. The eviction moratorium has been extended to March 31 and will likely be extended further. What happens when the moratorium ends? Will renters be required to pay current rent and back rent? Likely, there will be some period of “make-up.” If so, what happens to consumption and economic growth? Once again, renters have a much higher MPC than landlords. One solution I’ve heard is that the government will pay the landlords. Really? Do you think the government has the stomach to reimburse those “wealthy” landlords? (Not if Elizabeth and Bernie have anything to say!)
· There have been many surveys of how U.S. consumers have treated the recent “stimulus” checks and how they intend to treat any additional “free” monies from Uncle Sam. All come to similar conclusions:
- 30% will be used to boost savings
- 18% will be used to pay down debt
- 22% will be used to pay back rent
- Total is 70% that isn’t consumed.
· If 200 million people get $1,400 checks, that is equivalent to $280 billion. If 30% of that is used for consumption, GDP rises by $84 billion (about +0.4 pct. points). I’ve seen estimates as high as $550 billion (30% of the entire $1.9 trillion stimulus). Using the $550 billion number, that would increase GDP by about 2.75 pct. points. Likely, this is where the CBO comes up with their call that GDP will reach pre-pandemic levels by mid-year. Really, though, not much kick here!
· Bank lending has always been a good barometer of the strength of the economy. That makes sense. When businesses are growing and expanding, banks are lending. To show the state of the current economy, in 2020, three of the four largest U.S. banks saw loans and leases contract:
- BAC: -5.7%
- Citi: -3.4%
- Wells: -7.8%
- Only JPM showed higher loan balances.
Inflation Buzz
Markets expect inflation to reignite and the result has been a weekly back up in Treasury rates since the start of the year. The 10-year U.S. Treasury Note yield closed at 1.21% on Friday, February 12, up from 0.93% at the turn of the year. In past blogs, I have discussed the composition of the CPI (mostly services) and the deflation occurring in rents, medical, and tuition (45% of “Headline” CPI and 55% of “Core” CPI). With rents deflating, wages barely growing because of an oversupply of labor, and bank credit contracting (including credit card balances), it is quite difficult for significant inflation to appear. (There may be inflation in some commodity prices because of the difficulty in transportation, but they have a very small influence on the CPI.) In addition, given the levels of debt now in the corporate world, especially in the “zombie” companies (defined as those companies whose cash flows are inadequate to pay their debt service) (zombies now comprise 20% of the S&P 500), rising interest rates raise debt service costs and further siphon off profits.
Of course, interest rates can continue to rise (just as the equity markets can) as long as there is buy-in to the narrative that an economic “boom” will begin in Q3. But, eventually, reality will set in and those rates will come back down. You can also count on the Fed to limit any rate increases. Powell has indicated that in very plain English.
Conclusions
Equity markets continue to display “market top” behavior. Based on historical data, forward returns are likely to be muted.
Labor markets have recently shown renewed stagnation. There has been no progress in the labor market since October. Other high frequency data confirm the continuance of economic stagnation.
In addition, undiscussed in the media are the issues surrounding the impact of mortgage delinquencies, missed rents and stagnation in bank lending on economic growth.
The debt markets have semi-adopted the renewed inflation narrative, and rates have risen and may continue to do so in the near-term. Economic reality and the Fed will eventually reverse this trend. Lower for longer!


