The economic indicators used to gauge the performance of an economy and its outlook are the same across most nations. What differs is the relative importance of certain indicators to a specific economy at various points in time (for instance, housing indicators are closely watched when the housing market is booming or slumping), and the bodies or organizations compiling and disseminating these indicators in each nation.
Here are the 12 key economic indicators for Canada, the world’s 10th-largest economy:1
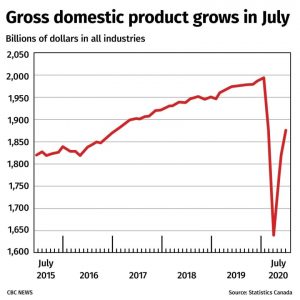
GDP Growth
Statistics Canada, a national agency, publishes growth statistics on the Canadian economy on monthly and quarterly bases. The report shows the real gross domestic product (GDP) for the overall economy and broken down by industry. It is an accurate monthly/quarterly status report on the Canadian economy and each industry within it.2
Employment Change and Unemployment
Key data on the Canadian employment market, such as the net change in employment, the unemployment rate, and participation rate, is contained in the monthly Labour Force Survey, released by Statistics Canada. The report contains a wealth of information about the Canadian job market, categorized by the demographic, class of worker (private sector employee, public sector employee, self-employed), industry, and province.3
Consumer Price Index
Statistics Canada releases a monthly report on the consumer price index (CPI) that measures inflation at the consumer level. The index is constructed by comparing changes over time in a fixed basket of goods and services purchased by consumers. The report shows the change in CPI monthly and over the past 12 months, on an overall and core (excluding food and energy prices) basis.4
International Merchandise Trade
This monthly report from Statistics Canada shows the nation’s imports and exports, as well as the net merchandise trade surplus or deficit. The report also compares the most current data with that for the preceding month. Exports and imports are shown by product category, and also for Canada’s top ten trading partners.5
RBC Manufacturing Purchasing Managers’ Index – PMI
Released on the first business day of each month, this indicator of trends in the Canadian manufacturing sector was launched in June 2011 by Royal Bank of Canada, in association with Markit and the Purchasing Management Association of Canada. RBC PMI readings above 50 signal expansion as compared to the previous month, while readings below 50 signal contraction. The monthly survey also tracks other information pertinent to the manufacturing sector, such as changes in output, new orders, employment, inventories, prices, and supplier delivery times.7
The Conference Board’s Consumer Confidence Index
The Conference Board of Canada’s Index of Consumer Confidence measures consumers’ levels of optimism in the state of the economy. It is a crucial indicator of near-term sales for consumer product companies in Canada, as well as an indicator of the outlook for the broad economy since consumer demand comprises such a significant part of it. The index is constructed on the basis of responses to four questions by a random sampling of Canadian households. Survey participants are asked how they view their households’ current and expected financial positions, their short-term employment outlook, and whether now is a good time to make a major purchase.8
Ivey Purchasing Managers Index – PMI
An index prepared by the Ivey Business School at Western University, the Ivey PMI measures the monthly variation in economic activity, as indicated by a panel of purchasing managers across Canada. It is based on responses by these purchasing managers to a single question: “Were your purchases last month in dollars higher, the same, or lower than in the previous month?” An index reading below 50 shows a decrease; a reading above 50 shows an increase. Panel members indicate changes in their organization’s activity over five broad categories: purchases, employment, inventories, supplier deliveries, and prices.9
Housing Starts
Canada Mortgage and Housing Corporation (CMHC) issues a monthly report on the sixth working day of every month, showing the previous month’s new residential construction activity. The data is presented by region, province, census metropolitan area, and dwelling type (single-detached or multiple-unit). The indicator is an important gauge of the state of the Canadian housing market.10
Home Sales
This key indicator of housing activity is compiled by the Canadian Real Estate Association (CREA) and is based on the number of home sales processed through the MLS (Multiple Listing Service) Systems of real estate boards and associations in Canada. The monthly report from the CREA shows the change in home sales across Canada, as well as for major markets, from month to month. The report also includes other important housing-related information, such as the change (as a percentage) in newly listed homes, the national sales-to-new listings ratio, months of housing inventory, the change in the MLS Home Price Index, and the national average price for homes sold within the month.11
Retail Sales
Statistics Canada releases a monthly report on retail sales activity across Canada, with changes shown on month-over-month and year-over-year bases. The headline number shows the percentage change in national retail sales on a dollar basis; the percentage change in volume terms is also shown. The retail sales figures are shown by industry and for each province or territory, and provide insights into Canadian consumer spending.12
Building Permits
The building permits survey conducted monthly by Statistics Canada collects data on the value of permits issued by Canadian municipalities for residential and non-residential buildings, as well as the number of residential dwellings authorized. Since building permit issuance is one of the very first steps in the process of construction, the aggregate building permits data are very useful as a leading indicator for assessing the state of the construction industry.13
The Bottom Line
The 12 economic indicators briefly described above show the health of key aspects of Canada’s economy: consumer spending, housing, manufacturing, employment, inflation, external trade, and economic growth. Taken together, they provide a comprehensive picture of the state of the Canadian economy.
OTTAWA – Statistics Canada says the country’s merchandise trade deficit narrowed to $1.3 billion in September as imports fell more than exports.
The result compared with a revised deficit of $1.5 billion for August. The initial estimate for August released last month had shown a deficit of $1.1 billion.
Statistics Canada says the results for September came as total exports edged down 0.1 per cent to $63.9 billion.
Exports of metal and non-metallic mineral products fell 5.4 per cent as exports of unwrought gold, silver, and platinum group metals, and their alloys, decreased 15.4 per cent. Exports of energy products dropped 2.6 per cent as lower prices weighed on crude oil exports.
Meanwhile, imports for September fell 0.4 per cent to $65.1 billion as imports of metal and non-metallic mineral products dropped 12.7 per cent.
In volume terms, total exports rose 1.4 per cent in September while total imports were essentially unchanged in September.
This report by The Canadian Press was first published Nov. 5, 2024.