adplus-dvertising
Connect with us

Real eState

Collapse of the Real-Estate “Tech” IPO & SPAC Stocks: House Flippers Opendoor & Redfin Come Unglued, after Zillow – WOLF STREET

Published

 on


“Tech” real-estate broker Compass and “tech” renters-insurance-seller Lemonade collapsed too. All eyes on “tech” mortgage-broker Better.com’s delayed SPAC deal. I can’t wait.

By Wolf Richter for WOLF STREET.

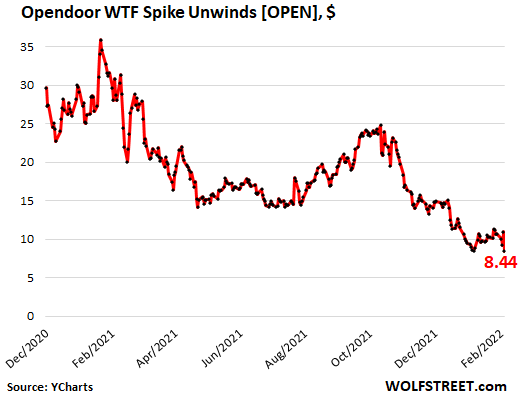
Even on Glorious Friday, the second day of a big rally after five days of sharp declines, the shares of a real-estate “tech” stock, house-flipper Opendoor, collapsed 23%, after having already collapsed in the months before.

Opendoor Technologies [OPEN], on Thursday evening, had reported a loss of $191 million for Q4, which brought its net loss for the year 2021 to $662 million, which brought its total losses for the four years that have been publicly disclosed to $1.5 billion. How can a house flipper lose $1.5 billion in four years? I don’t know either. But it isn’t over yet. And the company ended the year with an inventory of 17,009 unsold houses.

Opendoor went public in December 2020, at the IPO price of $31.47 amid enormous hoopla. By February 2021, shares had reached $39. If “February 2021” sounds familiar, it’s because that’s the month the stock market started coming unglued beneath the surface as highfliers started collapsing one at a time, each on its own schedule. The damage was such that I started reporting on it in May 2021. And this is just another chapter as it just keeps getting worse. On Friday, she shares closed at $8.44, down 78% from the February 2021 peak and 73% below its IPO price (data via YCharts):

300x250x1

Opendoor reported that it purchased 36,908 houses in 2021 but sold only 21,725 houses (for $8 billion) during the year, leaving it with 17,009 unsold homes ($6.1 billion) in inventory.

Opendoor financed this inventory with $6.1 billion in “non-recourse” debt backed by its houses. Non-recourse means if Opendoor defaults, its lenders get the house and cannot go after Opendoor’s other assets. If Opendoor cannot sell those homes and pay off the debt with the proceeds, it can hand the properties to the lenders and let them worry about selling the homes.

In addition, Opendoor was under contract to purchase 5,411 more homes for $1.9 billion.

About two-thirds of these 17,009 homes are finished and ready for resale. About one-third (about 5,500 homes) are “work-in-process” and are not for sale. Any of these 17,000 homes that haven’t been listed for sale, including all of the 5,500 homes that are work-in-process, are in the unknown pile of vacant homes that don’t show up in the official “supply” of homes and that don’t show up as vacant homes either.

Zillow did the same thing with a big portion of its 7,000 homes that were stuck in the pipeline before it quit the business last November and sold those homes mostly to institutional investors, who’re now trying to figure out what to do with them. These homes that are stuck in the house-flipper pipeline and that are shuffled around are vacant, but don’t show up as vacant, and they are not for sale, and don’t show up as “supply.”

House-flipping is easy – the first part, buying the house, when money is no objective, and your algo can spend as much as it wants. The rest is hard, and making money at it is even harder, especially if you overpaid in the first place. The activity is not suited for people who write algos, it turns out.

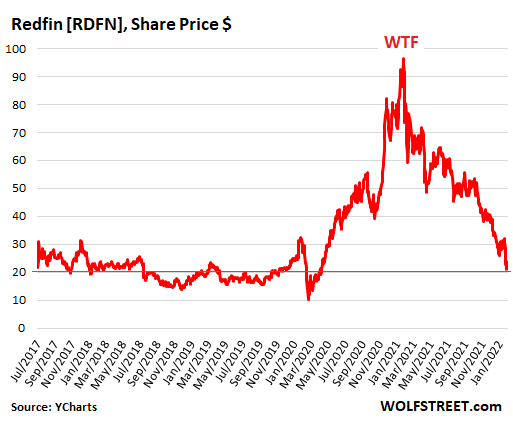
Redfin, originally an online real estate broker, also rode up the algo-based house-flipper craze starting in 2020. And its shares [RDFN] rocketed higher amid endless hoopla by the crazed crowd of stock jockeys and hit a high of $98.44 in February 2021 – yup, that February again.

Then shares began their long collapse. On Friday, they closed at $21.83, having collapsed by 78% in one year. They’re now below where they’d been after the first day of trading following its IPO in July 2017:

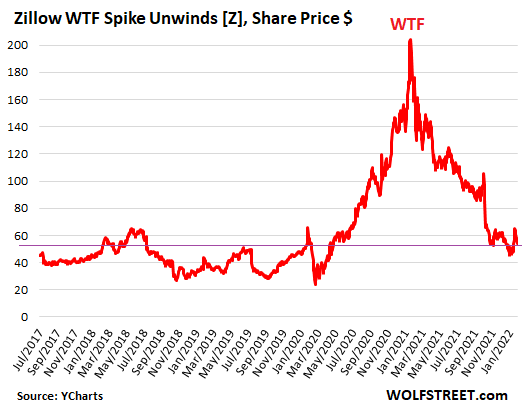
Zillow [ZG] had a brief respite in its collapse when it announced on February 10 that it lost $881 million in 2021 on its home-flipping escapade, which came unglued in November 2021, when it disclosed that it would lay off 25% of its staff and get out of the house-flipping business, and dump the 7,000 homes it had bought.

Later it disclosed that it had sold most of these houses to institutional investors – rather than to people who might have wanted to live in them. Until those vacant houses are listed for sale they don’t show up in the official “supply,” and many of them may eventually show up on the rental market. And while all this is going on as they’re being shuffled around, they don’t show up as vacant either.

The $881 million loss was less than feared, and shares bounced magically over the following three trading days, but have since then given up a portion of it. On Friday, shares closed at $57.95, down 73% from their high a year ago, and about level with where they’d been in February 2020 before the crash:

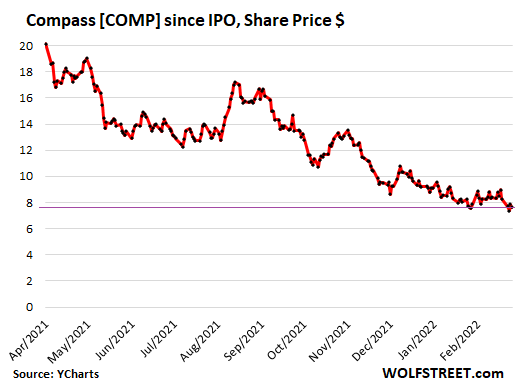
Compass, a real-estate broker that calls itself “a tech company reinventing the space,” is one of those examples – one of very many – when you realize something is seriously wrong with Wall Street. But OK, people have fun with their trading apps, and if they get cleaned out, so be it.

Compass grew by using Softbank’s money, and the money of other investors, to buy up real estate brokerages around the country. Over the five years of publicly disclosed financial statements, Compass has lost $1.44 billion. How can a real estate broker in the red-hottest no-questions-asked housing market lose $1.44 billion? That was a rhetorical question.

Compass shares [COMP] peaked on their first day of trading, following the IPO in April last year, at $22.11 and have declined ever since. On Friday, they closed at $7.65, having plunged 65% in 10 months since the high on the first day of trading, and are now 58% below the IPO price of $18 a share:

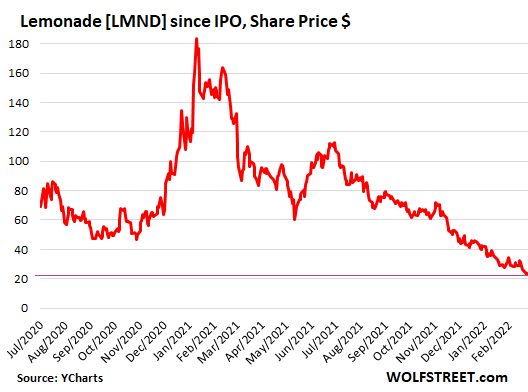
Lemonade [LMND], which is hyped as an “insurance tech company” and sells insurance for renters, homeowners, pet owners, etc., went public in July 2020 at $29 a share and in the first day of trading, amid immense hoopla, spiked 139%. It then continued spiking until it reached $182 in January 2021. And then came said February 2021, when this whole show started unraveling.

On Friday, shares closed at $23.48, down 83% from the high, and 19% below the IPO price at which the shares never even traded because the first trade was at $50 a share, causing the tech stock pundits to lament how the company “mispriced” the IPO and how much money it “left on the table.” Yup, that’s how crazy this show was at the time.

Waiting for a share-price collapse is Better.com, a “tech” mortgage lender, backed by Softbank. It’s not yet a publicly traded stock because its merger with a SPAC was postponed in December 2021 after the CEO fired 900 employees, most of them in India, via a Zoom meeting that went viral, that idiot.

With the SPAC merger, and therefore the inflow of cash, having been delayed, the company raised $750 million from Softbank and its SPAC backers because, you know, these kinds of companies constantly burn large amounts of cash and constantly need new cash to burn.

So I’m looking forward to the moment the stock finally starts trading so I can add it to this list of collapsing real-estate “tech” stocks. This should be a goodie. So let’s hope that the merger with the SPAC goes through.

Enjoy reading WOLF STREET and want to support it? Using ad blockers – I totally get why – but want to support the site? You can donate. I appreciate it immensely. Click on the beer and iced-tea mug to find out how:

Would you like to be notified via email when WOLF STREET publishes a new article? Sign up here.

Adblock test (Why?)

728x90x4

Source link

Continue Reading

Real eState

Caution about Canada's private real estate sector abounds as valuations slow to adjust – The Globe and Mail

Published

 on


Open this photo in gallery:

Valuations for Canada’s office real estate have taken longer to adjust than properties in other advanced economies.Jeff McIntosh/The Canadian Press

Sign up for the Globe Advisor weekly newsletter for professional financial advisors on our sign-up page. Get exclusive investment industry news and insights, the week’s top headlines, and what you and your clients need to know. For more from Globe Advisor, visit our homepage.

As the U.S. economy has pulled meaningfully ahead of Canada’s, so too has its private commercial real estate sector, which is adjusting more positively to the post-pandemic reality.

That’s particularly evident in both countries’ privately held office property markets. While the U.S.’s is well down the path of transforming, demolishing or otherwise ridding itself of empty office space, Canada’s has practically frozen in place following a wave of markdowns in 2023. That has made valuation assessments next to impossible.

300x250x1

“There’s a big dichotomy, and the Canadian market so far has not corrected,” says Victor Kuntzevitsky, portfolio manager with Stonehaven Private Counsel at Wellington-Altus Private Counsel Inc. in Aurora, Ont., which holds private real estate assets in credit and equity vehicles in both Canada and the U.S.

It’s no secret that last year was a difficult period for owners of Canadian private real estate, with many pension fund managers losing money as high interest rates drove up borrowing costs, inflation increased operating costs and vacancy rates remained high or even climbed.

The Caisse de dépôt et placement du Québec saw its real estate portfolio decline 6.2 per cent in 2023. The Ontario Teachers’ Pension Plan experienced a 5.9-per-cent loss in its real estate book, while markdowns on commercial properties owned by the Ontario Municipal Employees Retirement System (OMERS) resulted in its real estate portfolio dropping by 7.2 per cent.

However, there are pockets of strength investors can look to, says Colin Lynch, managing director and head of alternative investments at TD Asset Management Inc. These include multi-family residential and open-air retail centres, as well as industrial properties, which have been steady performers following strong gains through the pandemic.

It’s a view that dovetails with other analyses of the Canadian market. BMO Global Asset Management’s latest commercial property outlook notes that the industrial and multi-family segments remain strong due to high investor demand and tight supply.

“Office remains the asset class of the greatest near-term concern and focus,” the BMO GAM report states, estimating “a timeline for a return to ‘normal’ of a least five years.”

Mr. Lynch says while that timeframe could be accurate, private real estate investors need to evaluate opportunities on a city-by-city basis.

“Every city is very different. In fact, the smaller the city, the better the office property market has generally performed because commute times are much better, so in-office presence is much higher,” he says.

He points to cities such as Winnipeg, Regina and Saskatoon, where commute times can be 10 minutes and office workers are in four days a week on average.

However, there’s also room for more bad news, with some property owners struggling to refinance expensive debt in a higher-for-longer rate environment that could force firesales for lower-quality buildings.

The U.S. and other advanced real estate markets, such as the U.K., are “quarters ahead” of where the Canadian office market is in terms of valuation adjustments, Mr. Lynch says. A major reason is much of Canada’s commercial office real estate is owned by a relatively small group of large investment funds.

“Peak to trough in the U.K., for example, declines were about 20 per cent,” he says, noting that Canada’s market hasn’t corrected to that extent, but it is catching up.

Mr. Kuntzevitsky says these private fund assets are valued based on activity.

“The U.S. market is deeper, there’s more activity within it compared to Canada,” he says. “The auditors I speak to who value these funds are saying, ‘Listen, if there’s no activity in the marketplace, we’re just making assumptions.’”

Nicolas Schulman, senior wealth advisor and portfolio manager with the Schulman Group Family Wealth Management at National Bank Financial Wealth Management in Montreal, holds private real estate funds for clients and says he’s preparing to evaluate new investments in the Canadian space later in 2024.

“We don’t think the recovery would take a full five-year window, but we do believe it’s going to take a bit more time. Our conviction is, we want to start looking at the sector toward the end of this year,” Mr. Schulman says.

Mr. Kuntzevitsky says he’s been allocating any excess cash to the U.S. market in both private and publicly listed vehicles.

“The opportunity here is that you redeem your open-ended private [real estate investment trusts (REITs) in Canada] and reallocate the money to the U.S., where the private market reflects [net asset values] based on recent activity, or you can invest in publicly listed REITs,” he says.

Still, Mr. Kuntzevitsky is watching developments closer to home for evidence the market is turning.

In February, the Canada Pension Plan Investment Board and Oxford Properties Group Inc. struck a deal to sell two downtown Vancouver office buildings for about $300-million to Germany’s Deka Group – about 14 per cent less than they were targeting.

“Hopefully, that will activate the market,” Mr. Kuntzevitsky says. “But so far, we haven’t seen that yet.”

For more from Globe Advisor, visit our homepage.

Adblock test (Why?)

728x90x4

Source link

Continue Reading

Real eState

Proposed Toronto condo complex seeks gargantuan height increase – blogTO

Published

 on


300x250x1

A large condo complex proposed in the increasingly condo-packed Yonge and Eglinton neighbourhood is planning to go much taller.

Developer Madison Group has filed plans to increase the height of its planned two-tower condo complex at 50 Eglinton Ave. W., from previously approved heights of 33 and 35 storeys, respectively, to a significantly taller plan calling for 46- and 58-storey towers.

The dual skyscrapers will rise from a podium featuring restored facades of a heritage-designed Toronto Hydro substation building.

As of 2024, plans for high-rise development at this site have been evolving for over a dozen years, first as two separate projects before being folded into one. The height sought for this site has almost doubled in the years since first proposed, and it shouldn’t come as a huge surprise for anyone tracking development in this part of the city.

50 eglinton avenue west toronto

Early 2024 design for 50 Eglinton West before current height increase request.

Building on a 2023 approval for towers of 33 and 35 storeys, the developer filed an updated application at the start of 2024 seeking a slight height increase to 35 and 37 storeys.

Only a few months later, the latest update submitted with city planners this April reflects the changing landscape in the surrounding midtown area, where tower heights and density allotments have skyrocketed in recent years in advance of the Eglinton Crosstown LRT.

50 eglinton avenue west toronto

April 2024 vision for 50 Eglinton Avenue West.

The current design from Audax Architecture is a vertical extrusion of the previous plan that maintains all details, including stepbacks and material details.

That updated design introduced in January responds to an agreement that allows the developer to incorporate office space replacement required under the neighbourhood plan to a nearby development site at 90-110 Eglinton East.

According to a letter filed with the City, “As a result of the removal of the on-site office replacement, which altered the design and size of the podium, and to improve the heritage preservation approach to the former Toronto Hydro substation building… Madison engaged Audax Architecture and Turner Fleischer Architects to reimagine the architectural style and expression of the project.”

A total of 1,206 condominium units are proposed in the current version of the plan, with over 98 per cent of the total floor space allocated to residential space. Of that total, 553 units are planned for the shorter west tower, with 653 in the taller east tower.

A sizeable retail component of over 1,300 square metres would animate the base of the complex at Duplex and Eglinton.

The complex would be served by a three-level underground parking garage housing 216 spots for residents and visitors. Most residents would be expected to make use of the Eglinton Line 1 and future Line 5 stations across the street to the southeast for longer-haul commutes.

Lead photo by

Audax Architecture/Turner Fleischer Architects

Adblock test (Why?)

728x90x4

Source link

Continue Reading

Real eState

Luxury real estate prices just hit an all-time record – CNBC

Published

 on


In this article

Real estate is increasingly a tale of two markets — a luxury sector that is booming, and the rest of the market that continues to struggle with higher rates and low inventory.

300x250x1

Overall real estate sales fell 4% nationwide in the first quarter, according to Redfin. Yet, luxury real estate sales increased more than 2%, posting their best year-over-year gains in three years, according to Redfin.

Real estate experts and brokers chalk up the divergence to interest rates and supply. With mortgage rates now above 7% for a 30-year fixed loan, most homebuyers are finding prices out of reach. Affluent and wealthy buyers, however, are snapping up homes with cash, making them less vulnerable to high rates.

Nearly half of all luxury homes, defined by Redfin as homes in the top 5% of their metro area by value, were bought with all cash in the quarter, according to Redfin. That is the highest share in at least a decade. In Manhattan, all-cash deals hit a record 68% of all sales, according to Miller Samuel.

The flood of cash is also driving up prices at the top. Median luxury-home prices soared nearly 9% in the quarter, roughly twice the increase seen in the broader market, according to Redfin. The median price of luxury homes hit an all-time record of $1,225,000 during the period.

“People with the means to buy high-end homes are jumping in now because they feel confident prices will continue to rise,” said David Palmer, a Redfin agent in Seattle, where the median-priced luxury home sells for $2.7 million. “They’re ready to buy with more optimism and less apprehension.”

The Trump International Hotel and Tower New York building is seen from the balcony of an apartment unit in the AvalonBay Communities Inc. Park Loggia condominium at 15 West 61 Street in New York on May 15, 2019.
Mark Abramson | Bloomberg | Getty Images

The luxury market is also benefiting from more supply of homes for sale. Since wealthy sellers are more likely to buy with cash, they are not as worried about trading out of a low-rate mortgage like most homeowners. That has freed up the upper end of listings, creating more inventory and driving more sales.

The number of luxury homes for sale jumped 13% in the first quarter, compared to a 3% decline for the rest of the housing market, according to Redfin. While overall luxury inventory remains “well below” pre-pandemic levels, the number of luxury listings that came online during the first quarter jumped 19%, the report said.

“Prices continue to increase for high-end homes, so homeowners feel it’s a good time to cash in on their equity,” Palmer said.

Still, not all luxury markets are booming, and the strongest price growth is in areas not typically known for luxury homes. According to Redfin, the market with the fastest luxury price growth was Providence, Rhode Island, with prices up 16%, followed by New Brunswick, New Jersey, where prices were up 15%. New York City saw the biggest price decline, down 10%.

When it comes to overall sales of luxury homes, Seattle posted the strongest growth of any metro area, with sales up 37%. Austin, Texas ranked second with sales up 26%, followed by San Francisco with a 24% increase.

Luxury homes sold the fastest in Seattle, with a median days on the market of nine days, followed by Oakland, California, and San Jose, California.

Subscribe to CNBC’s Inside Wealth newsletter with Robert Frank.

Adblock test (Why?)

728x90x4

Source link

Continue Reading

Trending