A grizzly outlook for the economy. Photo-Illustration: Intelligencer; Photos: Getty Images
You don’t really need to know a lot about the economy or bond market to know that there’s one signal that investors live in fear of more than just about any other. It’s called the inverted yield curve — which just means a flippening of sorts in the relationship between long-term and short-term U.S. government bonds. Under normal conditions, the longer-term bonds – say, 10-year bonds – pay a higher rate of interest (aka yield) than shorter duration ones, like the two-year. When there’s an inversion, that relationship switches, so the 10-year temporarily pays a lower rate than the two-year. (The relationship of the yields on all Treasuries ranging from a one-month note to a 30-year bond constitutes the yield curve.) The phenomenon defies easy logic, but it has consistently predicted every recession for more than a half century.
Unfortunately, this is all very relevant to the health of the economy today: The yield curve inverted nearly a year ago, and it remains inverted. While some recession watchers have recently begun to declare the coast clear — predicting also that the indicator will fail this time — others note that the shape of the curve has been changing lately, and they are more worried than ever. To make sense of this high-stakes puzzle, we went to the definitive expert on yield-curve inversions: Campbell Harvey, a finance professor at Duke University, who originally discovered the pattern in 1986. I spoke with Harvey about what the current inversion means, whether there’s any reason to think this time could be different — and how he nearly made a guest appearance in the Sam Bankman-Fried trial.
Could I just ask you to explain the significance of an inverted yield curve, as if you were talking to your niece or nephew or your mother-in-law?
So the yield curve is just the difference between a long-term interest rate and a short-term rate. Think of a ten-year treasury bond as a long term rate and a three-month treasury bill as a short-term rate. So in a normal yield curve, which we see almost all the time, the long rate are higher than the short rates. It makes sense because there’s some risk of locking your money up for a longer period of time. But on certain rare occasions, this gets upended, and you get the short rates much higher than the long rates — that’s unusual, and it’s called an inverted yield curve and suggests a problem in the economy. And over the past eight recessions, from the late 1960s to today, every time we got that upending of the bond market, where the long-term rate was lower than a short-term rate, a recession followed without any false signals — so eight out of eight. And so this is perhaps the most reliable indicator of what will happen in the economy.
And does it usually happen because the Fed is raising rates?
So the yield curve can invert in many different ways. And given that there are only eight examples, there’s not a lot you can learn from each one. But I will say that the current inversion is what I consider the most dangerous type of inversion, where both the short rate and the long rate go up, but the short rate goes up more than the long rate. Let me tell you why. When the yield curve inverts, that’s bad for banks because the bank business model is that they pay depositors a short-term rate and then they receive interest from their loans that are longer term. So as the yield curve inverts, this damages their profitability, where they’re paying out more and receiving like the same or less. So an inversion, no matter how it’s structured, hurts the banks’ profitability.
But the particular type of inversion we’ve seen, where the long rates go up also, that damages not just profitability but the balance sheet. So the balance sheet of these banks has these longer-term obligations like these loans and mortgages or bonds, and they go down in value as these long rates go up. So this is exactly what happened with Silicon Valley Bank, where their government-bond portfolio had to be written down and that caused them to have negative equity and they went out of business. So this one is, like, not a good one.
The yield curve has been inverted for a while, and at first you thought that it might be a false signal. How has your thinking evolved on that?
Yeah, so the yield curve inverted in November 2022. On January 4, I wrote a LinkedIn post saying that this could be a false signal, and I had some credibility in saying that, given that it’s my model. But there was a very important caveat. I said, Yeah, I think we can dodge a recession, but it’s conditional on the Fed stopping their rate hikes. And that’s not what happened. I still believe that if the Fed had stopped their rate hikes in January, we could have avoided a recession. But given that the Fed has continued, all of this has really upended things.
And I think that pushing the rates up as high as they have has been counterproductive. They give the inflation reason, but it’s a false narrative. I believe that the true rate of inflation right now is more like 1.5 percent. So you can’t use the inflation excuse. The Fed has gone too far. They’re very late realizing that they need to pause or reverse course. It’s technically called overshooting.
There’s an interesting phenomenon with the yield-curve inversion now, which is that it’s starting to disinvert — which is to say, go back to a normal shape. In your model, what’s the significance of that?
So the average lead time from an inversion to a recession, over the past four, is 13 months. So we’re not even at the average yet — it’s way too early to say that it’s a false signal. But more importantly, you look at the past four recessions, and before the recession begins, every single time, you see the uninversion happening or whatever the word is. The steepening occurs before the beginning of the recession. So this is exactly what you’d expect.
Yes, “the bear steepening,” as people call it when the long end of the curve rises and the inversion ends.If that is happening now, when do you expect a recession?
I expect first quarter or second quarter of next year. It’s going to be very interesting because the third-quarter GDP is going to be very impressive, and people will think, Oh, well, this must be a false signal. But that growth has been driven exclusively by consumers drawing down their savings, the COVID-era savings, and those savings will run out in the fourth quarter. Plus the resumption of the student-loan payments affects 40 million Americans, and it’s all being taken away from disposable income. So many forces are suggesting that the consumer is not going to be able to bail out the economy in 2024.
So how worried are you? How bad do you think this time could be?
This is very important: I hope that my model is wrong. I certainly hope that it is a false signal, though I don’t believe it is, and kind of the good scenario for me is a mild recession, something like we had in 2001 or 1990. And ’91.
It’s important for people to remember that even though the 2020 recession was very short — because we had the pandemic and then we had all the aid — the yield-curve inversion predicted that too.
Be careful here. And some people say, Well, surely, the yield curve didn’t predict COVID. But in real time, when it inverted in 2019, there was a lot of other data that suggested that there was going to be a recession in 2020. So we’ll never know. It’s got kind of an asterisk on it because of COVID, but again, we likely would have had a recession anyway.
Does the severity of the inversion predict at all the severity of the recession?
No. But there is a very tight relationship between the duration of an inversion and duration of recession. And it depends when we uninvert, but it indicates that the recession could last about nine months to a year. So that’s obviously longer than the COVID one but shorter than the global financial crisis.
You haven’t had any false signals yet. But is there any reason to think this time is different?
Every time is different. And there’s many differences this time around. One difference is the excess demand for labor. So that’s kind of unique, and that I think is important because I think it will dull the blow. That excess demand has been decreasing, and it could go the other way very quickly. But nevertheless, I think that that is something that is different.
You mentioned that the yield-curve inversion hurts banks, and already we’ve seen some of the small-to-midsize banks fail. Do you think some of the big banks are at risk?
Given the further increases by the Fed, the banks are not in as good shape as they were, like, a year ago. This has really been punishing for the banks and frustrating because the Fed has taken the banks into a scenario that is far beyond the adverse scenario they get for their stress test. It’s a little bit unfair. So I think the financial system is at risk right now. Here’s something interesting that I’m frustrated the media has not picked up on: You know, you can get like 5.2 percent or something like that in a money-market fund? Most people don’t do that. They’ve got a savings account, and the average savings rate across all banks in the US is about 0.5%. So that is kind of dramatic — you can get in a money-market fund ten times what you’re getting from your bank. But that’s not the whole story. The too-big-to-fail banks are only paying like .01% to .05% on savings. That gap between what they’re paying on savings and what you could reasonably get from another vehicle, that to me is a red flag. And that suggests to me that the financial system is far more at risk than people think.
We’ve seen even with the recent jobs data that the economy keeps adding jobs. And it seems like some economists — at the Fed and elsewhere — sort of won’t be happy until we have more unemployment. What do you think?
Unemployment is a lagging indicator. So you need to be careful. It always is low before a recession, and we’re not there yet. We’re in strong growth.
You’re known for your work on the yield-curve inversion, but you’ve also written a book on DeFi and you follow crypto pretty closely. Have you been following what’s been happening in the regulatory landscape and the Sam Bankman-Fried trial?
Yeah, I was actually asked to be an expert for Sam Bankman-Fried’s defense. So I declined that. But I am following very closely. I think they wanted me to give an opinion on the whole exchange thing and be available to kind of teach the jury and the judge about some of the subtleties of the space. And again, that’s not decentralized finance. That’s centralized finance. He was running a centralized exchange and committing fraud by channeling customer money to a hedge fund. It had nothing to do with DeFi, other than trading some decentralized tokens.
What is your outlook for crypto in the US now?
I think the big growth area is with just regular companies using this technology. So I’m quite positive.
OTTAWA – Canada’s unemployment rate held steady at 6.5 per cent last month as hiring remained weak across the economy.
Statistics Canada’s labour force survey on Friday said employment rose by a modest 15,000 jobs in October.
Business, building and support services saw the largest gain in employment.
Meanwhile, finance, insurance, real estate, rental and leasing experienced the largest decline.
Many economists see weakness in the job market continuing in the short term, before the Bank of Canada’s interest rate cuts spark a rebound in economic growth next year.
Despite ongoing softness in the labour market, however, strong wage growth has raged on in Canada. Average hourly wages in October grew 4.9 per cent from a year ago, reaching $35.76.
Friday’s report also shed some light on the financial health of households.
According to the agency, 28.8 per cent of Canadians aged 15 or older were living in a household that had difficulty meeting financial needs – like food and housing – in the previous four weeks.
That was down from 33.1 per cent in October 2023 and 35.5 per cent in October 2022, but still above the 20.4 per cent figure recorded in October 2020.
People living in a rented home were more likely to report difficulty meeting financial needs, with nearly four in 10 reporting that was the case.
That compares with just under a quarter of those living in an owned home by a household member.
Immigrants were also more likely to report facing financial strain last month, with about four out of 10 immigrants who landed in the last year doing so.
That compares with about three in 10 more established immigrants and one in four of people born in Canada.
This report by The Canadian Press was first published Nov. 8, 2024.
The Canadian Institute for Health Information says health-care spending in Canada is projected to reach a new high in 2024.
The annual report released Thursday says total health spending is expected to hit $372 billion, or $9,054 per Canadian.
CIHI’s national analysis predicts expenditures will rise by 5.7 per cent in 2024, compared to 4.5 per cent in 2023 and 1.7 per cent in 2022.
This year’s health spending is estimated to represent 12.4 per cent of Canada’s gross domestic product. Excluding two years of the pandemic, it would be the highest ratio in the country’s history.
While it’s not unusual for health expenditures to outpace economic growth, the report says this could be the case for the next several years due to Canada’s growing population and its aging demographic.
Canada’s per capita spending on health care in 2022 was among the highest in the world, but still less than countries such as the United States and Sweden.
The report notes that the Canadian dental and pharmacare plans could push health-care spending even further as more people who previously couldn’t afford these services start using them.
This report by The Canadian Press was first published Nov. 7, 2024.
Canadian Press health coverage receives support through a partnership with the Canadian Medical Association. CP is solely responsible for this content.
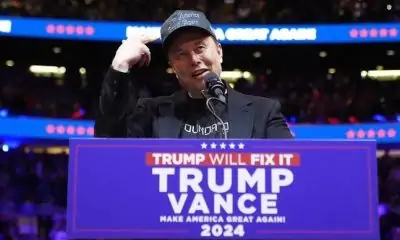
As Canadians wake up to news that Donald Trump will return to the White House, the president-elect’s protectionist stance is casting a spotlight on what effect his second term will have on Canada-U.S. economic ties.
Some Canadian business leaders have expressed worry over Trump’s promise to introduce a universal 10 per cent tariff on all American imports.
A Canadian Chamber of Commerce report released last month suggested those tariffs would shrink the Canadian economy, resulting in around $30 billion per year in economic costs.
More than 77 per cent of Canadian exports go to the U.S.
Canada’s manufacturing sector faces the biggest risk should Trump push forward on imposing broad tariffs, said Canadian Manufacturers and Exporters president and CEO Dennis Darby. He said the sector is the “most trade-exposed” within Canada.
“It’s in the U.S.’s best interest, it’s in our best interest, but most importantly for consumers across North America, that we’re able to trade goods, materials, ingredients, as we have under the trade agreements,” Darby said in an interview.
“It’s a more complex or complicated outcome than it would have been with the Democrats, but we’ve had to deal with this before and we’re going to do our best to deal with it again.”
American economists have also warned Trump’s plan could cause inflation and possibly a recession, which could have ripple effects in Canada.
It’s consumers who will ultimately feel the burden of any inflationary effect caused by broad tariffs, said Darby.
“A tariff tends to raise costs, and it ultimately raises prices, so that’s something that we have to be prepared for,” he said.
“It could tilt production mandates. A tariff makes goods more expensive, but on the same token, it also will make inputs for the U.S. more expensive.”
A report last month by TD economist Marc Ercolao said research shows a full-scale implementation of Trump’s tariff plan could lead to a near-five per cent reduction in Canadian export volumes to the U.S. by early-2027, relative to current baseline forecasts.
Retaliation by Canada would also increase costs for domestic producers, and push import volumes lower in the process.
“Slowing import activity mitigates some of the negative net trade impact on total GDP enough to avoid a technical recession, but still produces a period of extended stagnation through 2025 and 2026,” Ercolao said.
Since the Canada-United States-Mexico Agreement came into effect in 2020, trade between Canada and the U.S. has surged by 46 per cent, according to the Toronto Region Board of Trade.
With that deal is up for review in 2026, Canadian Chamber of Commerce president and CEO Candace Laing said the Canadian government “must collaborate effectively with the Trump administration to preserve and strengthen our bilateral economic partnership.”
“With an impressive $3.6 billion in daily trade, Canada and the United States are each other’s closest international partners. The secure and efficient flow of goods and people across our border … remains essential for the economies of both countries,” she said in a statement.
“By resisting tariffs and trade barriers that will only raise prices and hurt consumers in both countries, Canada and the United States can strengthen resilient cross-border supply chains that enhance our shared economic security.”
This report by The Canadian Press was first published Nov. 6, 2024.