Howard Marks put it nicely when he said that, rather than worrying about share price volatility, ‘The possibility of permanent loss is the risk I worry about… and every practical investor I know worries about.’ So it might be obvious that you need to consider debt, when you think about how risky any given stock is, because too much debt can sink a company. As with many other companies Alphabet Inc. (NASDAQ:GOOGL) makes use of debt. But should shareholders be worried about its use of debt?
What Risk Does Debt Bring?
Debt assists a business until the business has trouble paying it off, either with new capital or with free cash flow. Ultimately, if the company can’t fulfill its legal obligations to repay debt, shareholders could walk away with nothing. However, a more usual (but still expensive) situation is where a company must dilute shareholders at a cheap share price simply to get debt under control. Of course, plenty of companies use debt to fund growth, without any negative consequences. When we examine debt levels, we first consider both cash and debt levels, together.
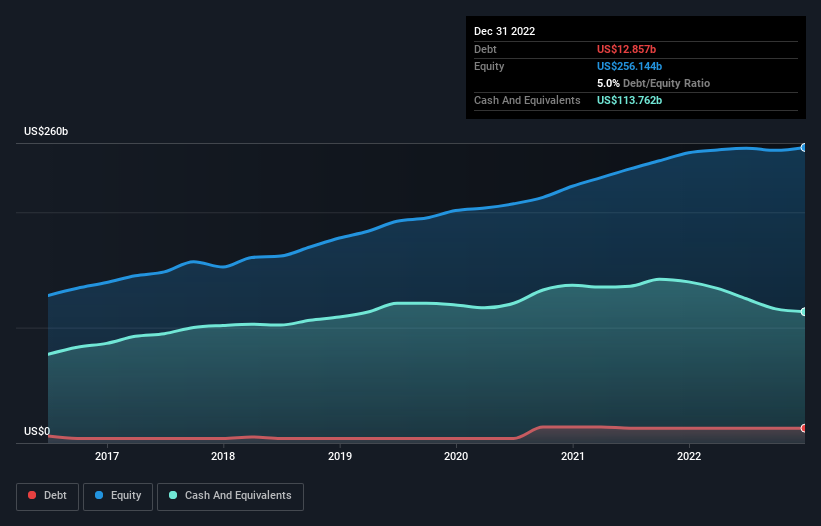
As you can see below, Alphabet had US$12.9b of debt, at December 2022, which is about the same as the year before. You can click the chart for greater detail. However, its balance sheet shows it holds US$113.8b in cash, so it actually has US$100.9b net cash.
debt-equity-history-analysis
How Strong Is Alphabet’s Balance Sheet?
The latest balance sheet data shows that Alphabet had liabilities of US$69.3b due within a year, and liabilities of US$39.8b falling due after that. On the other hand, it had cash of US$113.8b and US$40.3b worth of receivables due within a year. So it can boast US$44.9b more liquid assets than total liabilities.
This short term liquidity is a sign that Alphabet could probably pay off its debt with ease, as its balance sheet is far from stretched. Succinctly put, Alphabet boasts net cash, so it’s fair to say it does not have a heavy debt load!
On the other hand, Alphabet saw its EBIT drop by 4.9% in the last twelve months. That sort of decline, if sustained, will obviously make debt harder to handle. When analysing debt levels, the balance sheet is the obvious place to start. But it is future earnings, more than anything, that will determine Alphabet’s ability to maintain a healthy balance sheet going forward. So if you want to see what the professionals think, you might find this free report on analyst profit forecasts to be interesting.
Finally, while the tax-man may adore accounting profits, lenders only accept cold hard cash. Alphabet may have net cash on the balance sheet, but it is still interesting to look at how well the business converts its earnings before interest and tax (EBIT) to free cash flow, because that will influence both its need for, and its capacity to manage debt. During the last three years, Alphabet generated free cash flow amounting to a very robust 87% of its EBIT, more than we’d expect. That puts it in a very strong position to pay down debt.
Summing Up
While it is always sensible to investigate a company’s debt, in this case Alphabet has US$100.9b in net cash and a decent-looking balance sheet. The cherry on top was that in converted 87% of that EBIT to free cash flow, bringing in US$60b. So is Alphabet’s debt a risk? It doesn’t seem so to us. Above most other metrics, we think its important to track how fast earnings per share is growing, if at all. If you’ve also come to that realization, you’re in luck, because today you can view this interactive graph of Alphabet’s earnings per share history for free.
TORONTO – Canada’s main stock index was up more than 100 points in late-morning trading, helped by strength in base metal and utility stocks, while U.S. stock markets were mixed.
The S&P/TSX composite index was up 103.40 points at 24,542.48.
In New York, the Dow Jones industrial average was up 192.31 points at 42,932.73. The S&P 500 index was up 7.14 points at 5,822.40, while the Nasdaq composite was down 9.03 points at 18,306.56.
The Canadian dollar traded for 72.61 cents US compared with 72.44 cents US on Tuesday.
The November crude oil contract was down 71 cents at US$69.87 per barrel and the November natural gas contract was down eight cents at US$2.42 per mmBTU.
The December gold contract was up US$7.20 at US$2,686.10 an ounce and the December copper contract was up a penny at US$4.35 a pound.
This report by The Canadian Press was first published Oct. 16, 2024.
TORONTO – Canada’s main stock index was up more than 200 points in late-morning trading, while U.S. stock markets were also headed higher.
The S&P/TSX composite index was up 205.86 points at 24,508.12.
In New York, the Dow Jones industrial average was up 336.62 points at 42,790.74. The S&P 500 index was up 34.19 points at 5,814.24, while the Nasdaq composite was up 60.27 points at 18.342.32.
The Canadian dollar traded for 72.61 cents US compared with 72.71 cents US on Thursday.
The November crude oil contract was down 15 cents at US$75.70 per barrel and the November natural gas contract was down two cents at US$2.65 per mmBTU.
The December gold contract was down US$29.60 at US$2,668.90 an ounce and the December copper contract was up four cents at US$4.47 a pound.
This report by The Canadian Press was first published Oct. 11, 2024.
TORONTO – Canada’s main stock index was little changed in late-morning trading as the financial sector fell, but energy and base metal stocks moved higher.
The S&P/TSX composite index was up 0.05 of a point at 24,224.95.
In New York, the Dow Jones industrial average was down 94.31 points at 42,417.69. The S&P 500 index was down 10.91 points at 5,781.13, while the Nasdaq composite was down 29.59 points at 18,262.03.
The Canadian dollar traded for 72.71 cents US compared with 73.05 cents US on Wednesday.
The November crude oil contract was up US$1.69 at US$74.93 per barrel and the November natural gas contract was up a penny at US$2.67 per mmBTU.
The December gold contract was up US$14.70 at US$2,640.70 an ounce and the December copper contract was up two cents at US$4.42 a pound.
This report by The Canadian Press was first published Oct. 10, 2024.