David Iben put it well when he said, ‘Volatility is not a risk we care about. What we care about is avoiding the permanent loss of capital.’ It’s only natural to consider a company’s balance sheet when you examine how risky it is, since debt is often involved when a business collapses. We can see that The Coca-Cola Company (NYSE:KO) does use debt in its business. But is this debt a concern to shareholders?
When Is Debt Dangerous?
Debt and other liabilities become risky for a business when it cannot easily fulfill those obligations, either with free cash flow or by raising capital at an attractive price. If things get really bad, the lenders can take control of the business. While that is not too common, we often do see indebted companies permanently diluting shareholders because lenders force them to raise capital at a distressed price. By replacing dilution, though, debt can be an extremely good tool for businesses that need capital to invest in growth at high rates of return. The first thing to do when considering how much debt a business uses is to look at its cash and debt together.
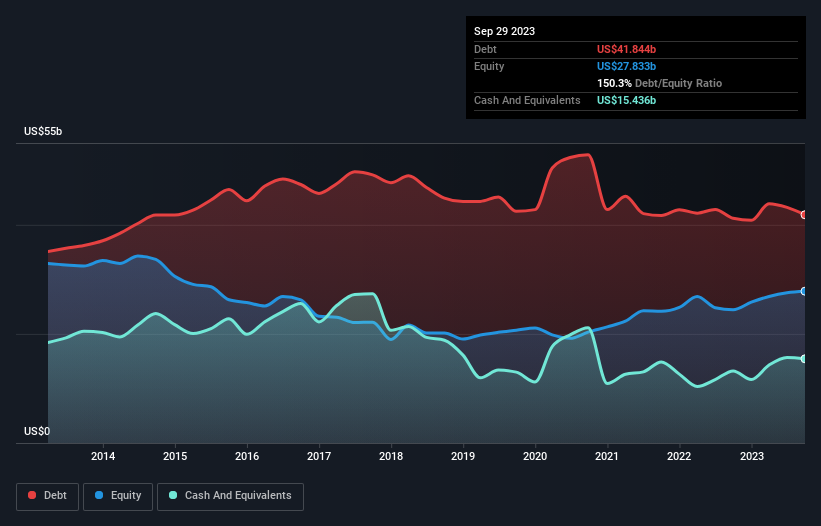
The chart below, which you can click on for greater detail, shows that Coca-Cola had US$41.8b in debt in September 2023; about the same as the year before. However, it also had US$15.4b in cash, and so its net debt is US$26.4b.
debt-equity-history-analysis
How Strong Is Coca-Cola’s Balance Sheet?
Zooming in on the latest balance sheet data, we can see that Coca-Cola had liabilities of US$24.4b due within 12 months and liabilities of US$45.3b due beyond that. Offsetting this, it had US$15.4b in cash and US$3.50b in receivables that were due within 12 months. So its liabilities total US$50.8b more than the combination of its cash and short-term receivables.
Since publicly traded Coca-Cola shares are worth a very impressive total of US$256.7b, it seems unlikely that this level of liabilities would be a major threat. Having said that, it’s clear that we should continue to monitor its balance sheet, lest it change for the worse.
In order to size up a company’s debt relative to its earnings, we calculate its net debt divided by its earnings before interest, tax, depreciation, and amortization (EBITDA) and its earnings before interest and tax (EBIT) divided by its interest expense (its interest cover). Thus we consider debt relative to earnings both with and without depreciation and amortization expenses.
Coca-Cola’s net debt to EBITDA ratio of about 1.9 suggests only moderate use of debt. And its strong interest cover of 30.6 times, makes us even more comfortable. We saw Coca-Cola grow its EBIT by 6.3% in the last twelve months. That’s far from incredible but it is a good thing, when it comes to paying off debt. When analysing debt levels, the balance sheet is the obvious place to start. But ultimately the future profitability of the business will decide if Coca-Cola can strengthen its balance sheet over time. So if you want to see what the professionals think, you might find this free report on analyst profit forecasts to be interesting.
But our final consideration is also important, because a company cannot pay debt with paper profits; it needs cold hard cash. So we clearly need to look at whether that EBIT is leading to corresponding free cash flow. Over the last three years, Coca-Cola recorded free cash flow worth a fulsome 86% of its EBIT, which is stronger than we’d usually expect. That positions it well to pay down debt if desirable to do so.
Our View
Happily, Coca-Cola’s impressive interest cover implies it has the upper hand on its debt. And the good news does not stop there, as its conversion of EBIT to free cash flow also supports that impression! When we consider the range of factors above, it looks like Coca-Cola is pretty sensible with its use of debt. That means they are taking on a bit more risk, in the hope of boosting shareholder returns. There’s no doubt that we learn most about debt from the balance sheet. But ultimately, every company can contain risks that exist outside of the balance sheet. These risks can be hard to spot. Every company has them, and we’ve spotted 1 warning sign for Coca-Cola you should know about.
TORONTO – Canada’s main stock index was up more than 100 points in late-morning trading, helped by strength in base metal and utility stocks, while U.S. stock markets were mixed.
The S&P/TSX composite index was up 103.40 points at 24,542.48.
In New York, the Dow Jones industrial average was up 192.31 points at 42,932.73. The S&P 500 index was up 7.14 points at 5,822.40, while the Nasdaq composite was down 9.03 points at 18,306.56.
The Canadian dollar traded for 72.61 cents US compared with 72.44 cents US on Tuesday.
The November crude oil contract was down 71 cents at US$69.87 per barrel and the November natural gas contract was down eight cents at US$2.42 per mmBTU.
The December gold contract was up US$7.20 at US$2,686.10 an ounce and the December copper contract was up a penny at US$4.35 a pound.
This report by The Canadian Press was first published Oct. 16, 2024.
TORONTO – Canada’s main stock index was up more than 200 points in late-morning trading, while U.S. stock markets were also headed higher.
The S&P/TSX composite index was up 205.86 points at 24,508.12.
In New York, the Dow Jones industrial average was up 336.62 points at 42,790.74. The S&P 500 index was up 34.19 points at 5,814.24, while the Nasdaq composite was up 60.27 points at 18.342.32.
The Canadian dollar traded for 72.61 cents US compared with 72.71 cents US on Thursday.
The November crude oil contract was down 15 cents at US$75.70 per barrel and the November natural gas contract was down two cents at US$2.65 per mmBTU.
The December gold contract was down US$29.60 at US$2,668.90 an ounce and the December copper contract was up four cents at US$4.47 a pound.
This report by The Canadian Press was first published Oct. 11, 2024.
TORONTO – Canada’s main stock index was little changed in late-morning trading as the financial sector fell, but energy and base metal stocks moved higher.
The S&P/TSX composite index was up 0.05 of a point at 24,224.95.
In New York, the Dow Jones industrial average was down 94.31 points at 42,417.69. The S&P 500 index was down 10.91 points at 5,781.13, while the Nasdaq composite was down 29.59 points at 18,262.03.
The Canadian dollar traded for 72.71 cents US compared with 73.05 cents US on Wednesday.
The November crude oil contract was up US$1.69 at US$74.93 per barrel and the November natural gas contract was up a penny at US$2.67 per mmBTU.
The December gold contract was up US$14.70 at US$2,640.70 an ounce and the December copper contract was up two cents at US$4.42 a pound.
This report by The Canadian Press was first published Oct. 10, 2024.