


Photo by Wang Ying
Xinhua News Agency/Getty Images
The Dow Jones Industrial Average, S&P 500 and Nasdaq Composite set new all-time intraday highs on Friday, December 27 as “inflating parabolic bubbles” on weekly charts inflate to record weekly stochastic readings.
The 12x3x3 weekly slow stochastic readings have risen to 93.96 for the Dow 30, 96.38 for the S&P 500, 95.82 for the Nasdaq and 92.94 for the Russell 2000—well above 90, which is the reading that defines a inflating parabolic bubble. The readings for Dow Transports have been declining below the overbought threshold of 80.
The year end closes on December 31 will be important inputs to my proprietary analytics. This will result in new annual, semiannual, quarterly and monthly value levels and risky levels. More on this later.
The important levels for this week are risky levels at 28,990 for the Dow; 3,262.2 for the S&P; 9,065 Nasdaq; 10,960 Dow Transports and 1,675.33 Russell 2000.
On Thursday, January 2, 2020 I will have new levels for every ticker in the universe. Check out your key levels here.
If the December 31 closes are little changed from the December 27 closes, here’s your risk/reward for 2020:
The upside for 2020 should be limited to 4% to 7% with the Dow showing a max of 30,400. The max for the S&P 500 is 3,470 and 9,370 for the Nasdaq. The downside risk is a bear market decline of at least 20% given weekly closes below first quarter value levels around 27,500 Dow, 3,100 S&P 500 and 8,875 Nasdaq. I will show no value levels in the first half of 2020 given weakness below these levels.
Here’s Last Week’s Scorecard
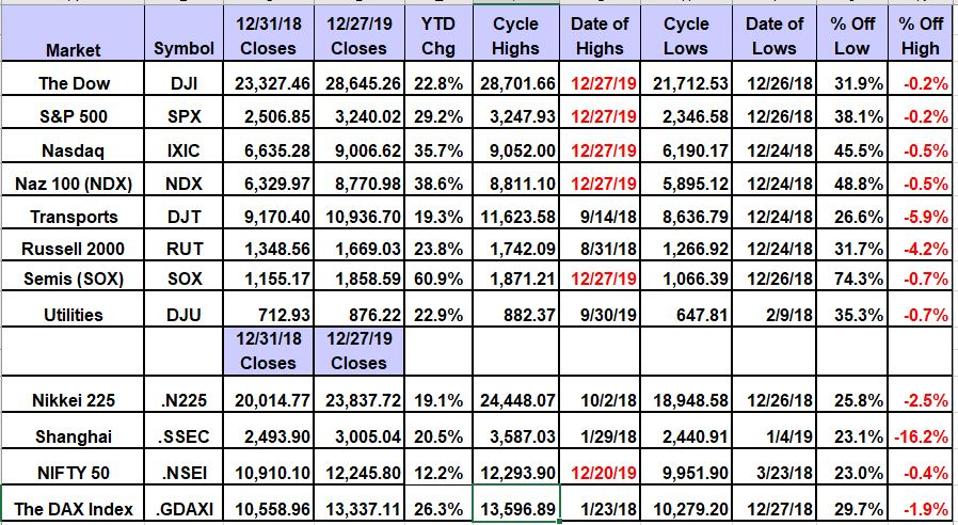
Scorecard for the Major Equity Averages
Global Market Consultants
The Dow (28,645 on December 27) has downside risk to its 200-day simple moving average at 26,700, last tested at 25,853 on October 3, 2019. The 200-week simple moving average or “reversion to the mean” is 23,054, last tested during the week of February 12, 2016 when the average was 15,819.
The S&P 500 (3,240 on December 27) has downside risk to its 200-day simple moving average at 2,963.8, last tested at 2,775 on June 4, 2019. The 200-week simple moving average or reversion to the mean is 2,577, last tested during the week of December 28, 2018 when the average was 2,349.
The Nasdaq Composite (9,007 on December 27) has downside risk to its 200-day simple moving average at 8,099, last tested at 7,714 on October 3, 2019. The 200-week simple moving average or reversion to the mean is 6,734, which has not been tested since September 2010.
The Dow Transportation Average (10,937 on December 27) has downside risk to its 200-day simple moving average at 10,492, last tested at 10,460 on December 3, 2019. The 200-week simple moving average or reversion to the mean is 9,721, last tested during the week of January 11, 2019 when the average was 9,112.
The Russell 2000 (1,669 on December 27) has downside risk to its 200-day simple moving average at 1,555.25, last tested at 1,532 on October 18, 2019. The 200-week simple moving average or reversion to the mean is 1,450.69, last tested during the week of January 4, 2019 when the average was 1,354.86.
Note that December 27 was a “key reversal” day for the small-cap index. After setting its 2019 high of 1,681.67, it closed below the December 26 low of 1,675.09.


