I am a 34-year-old with a high risk tolerance. All of my investment accounts are 100% invested in stocks. The one thing I have a hard time finding a tried and true answer on when I do research is how to best allocate my stock investments among large-cap, mid-cap, international, emerging markets, etc. I’m not looking to get the highest return possible per se (although that would be nice), rather, I am looking to have a well-diversified portfolio that gives me exposure to the various aspects of the stock market so that my long-term return is 7%-10%. I have always utilized the following allocation for no other reason than it seems reasonable and is well diversified:
33% U.S. large cap
17% U.S. mid cap
16% U.S. small cap
20% developed international
14% emerging markets
Does this seem about right to you? Would love to know how you think about your stock allocation and what you utilize as a good benchmark.
I can’t promise anything when it comes to future returns for the stock market but a global benchmark for the stock market is fairly straightforward.
The world stock market is a good starting point to compare your 100% stock portfolio to because that’s the investable universe.
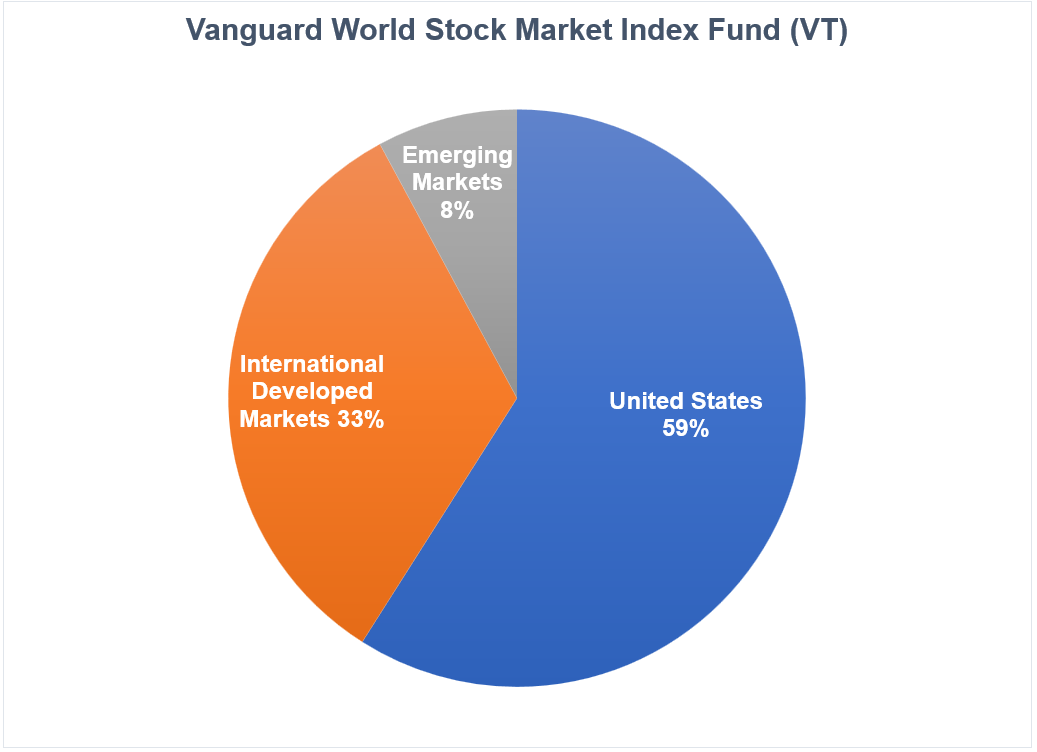
Here’s the current breakdown based on the Vanguard World Stock Market ETF (VT):
That’s nearly 60% in U.S. stocks, one-third in foreign developed stocks and just under 10% in emerging markets.
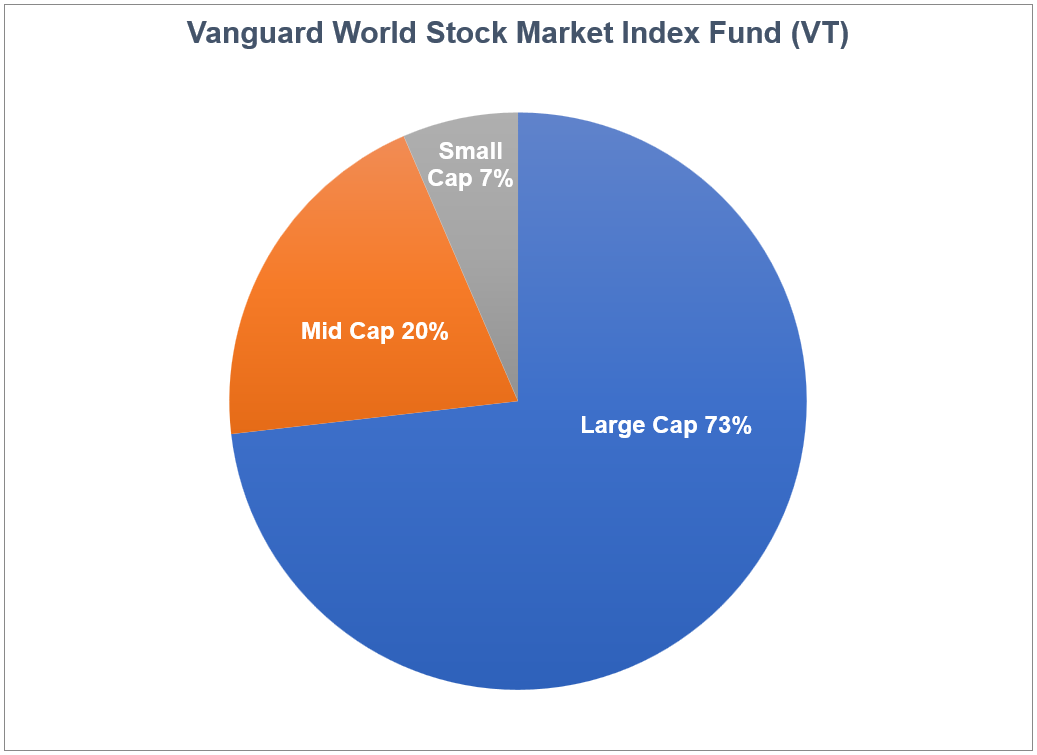
This is market cap breakdown on a global basis:
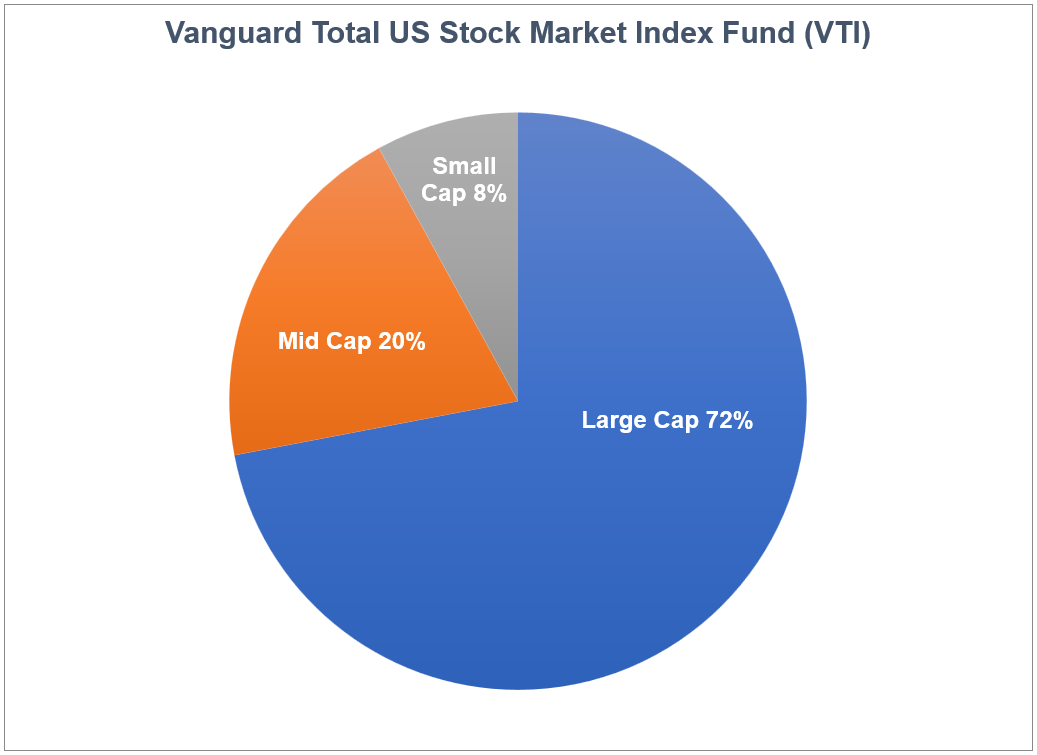
The large, mid and small weightings globally are basically the same as they are in the United States:
I’m not saying you have to follow global weightings (actually the portfolio in question is pretty close). I just think the global market cap is a good jumping-off point to see where you differ from the actual market.
If nothing else, you can use the world stock market as a benchmark for performance attribution and understand where your bets are being made.
Many investors probably assume the S&P 500 or a total U.S. stock market index fund should be the benchmark of choice. With the United States making up 60% of the total pie and getting all of the publicity when it comes to the financial media, I understand why this would be the case.
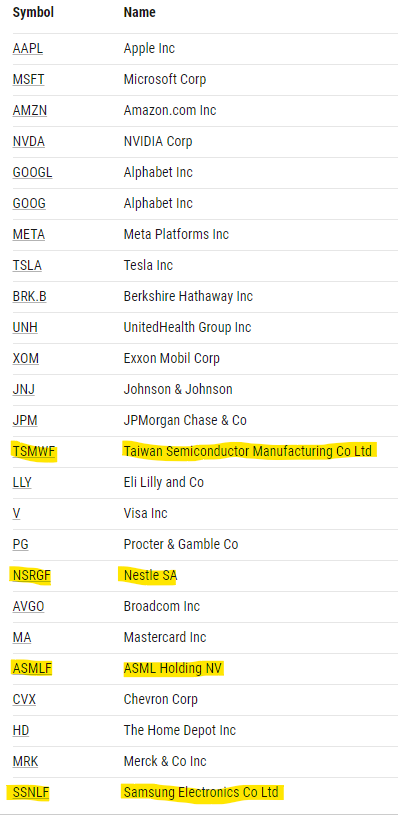
In fact, out of the top 25 holdings for the Vanguard World Stock Market Index Fund, just 4 are foreign companies:
America dominates the stock market.
I do, however, still think there is room for diversification if you’re going to invest your entire portfolio in stocks.
I know it seems like the S&P 500 always outperforms small caps, mid caps, international developed markets and emerging markets but you don’t have to go back that far to find a time when the biggest companies in America underperformed.
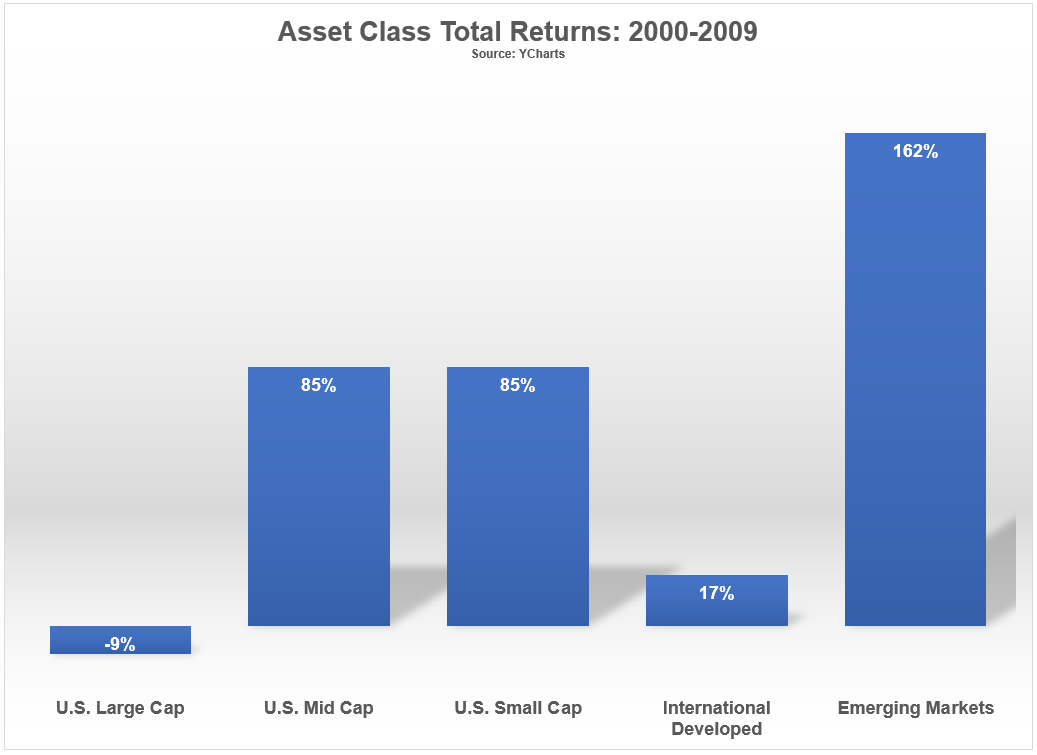
There are the total returns1 in the first decade of the 21st century:
It was a lost decade for the S&P 500. And diversification saved the day if you spread your bets among these other areas of the market.
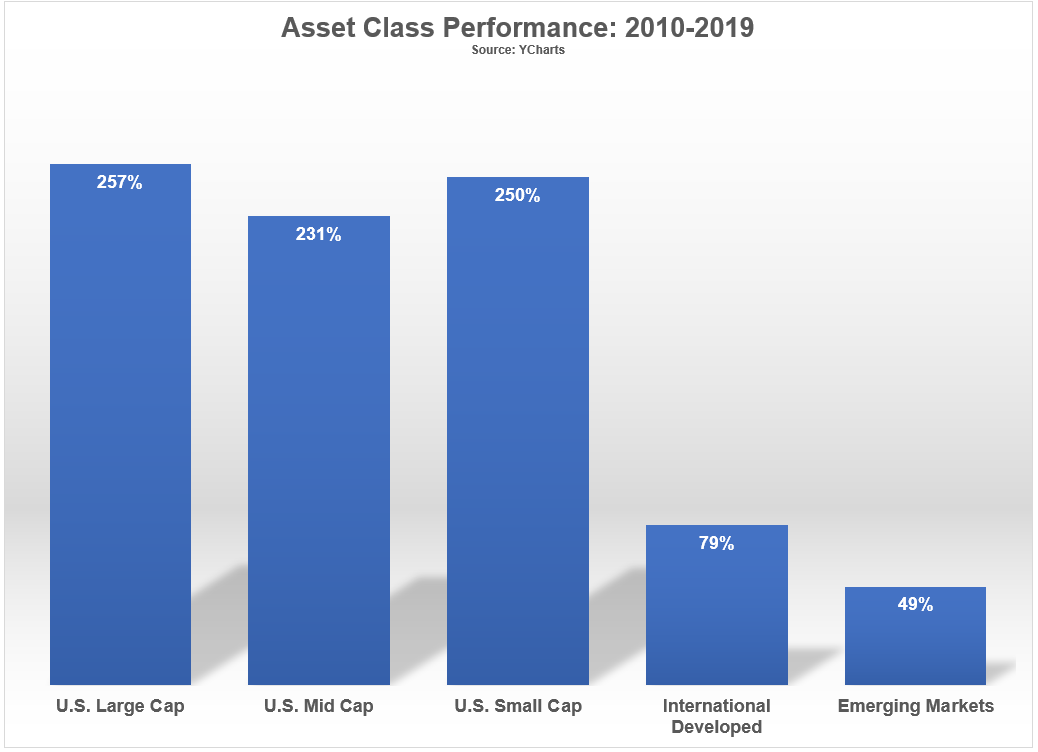
Now here’s what happened in the ensuing decade:
The S&P 500 came back with a vengeance while emerging markets went from first place to last place.
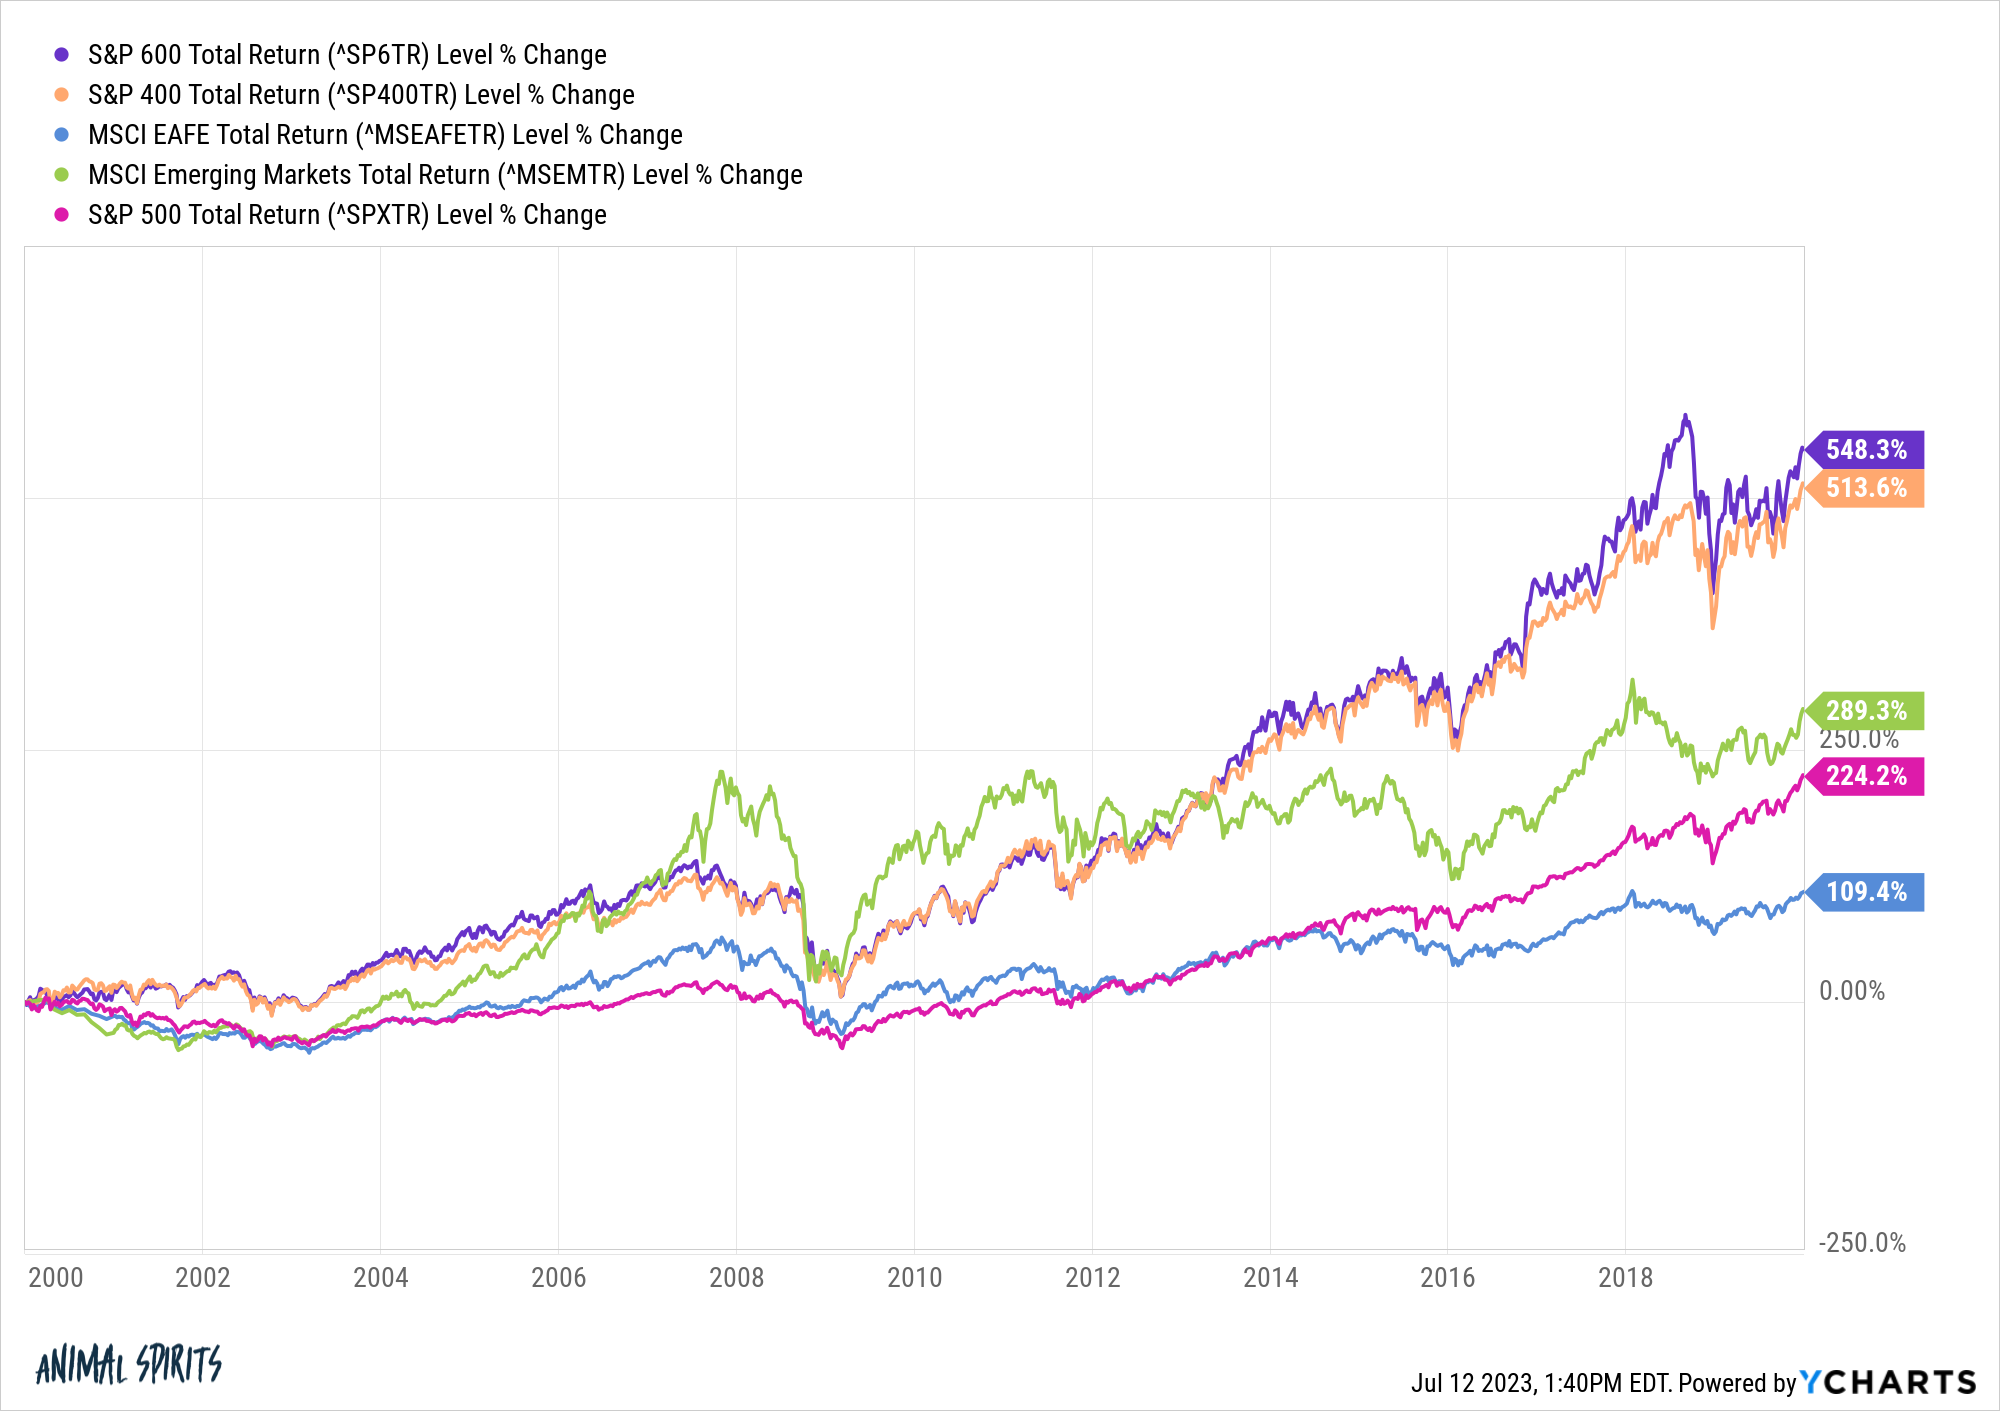
Now here’s what it looks like if we put it all together for both decades:
Surprisingly, the S&P 500 ranks second to last in terms of total performance from 2000-2019.
Some of this has to do with the start and end dates chosen here. The year 2000 was likely the worst entry point in modern U.S. stock market history.2 I could change the start date and the S&P would look at lot better than this.
But maybe that’s my point.
You just never know when certain markets, geographies, market caps or risk factors are going to knock the cover off the ball or strike out.
That’s why I think diversification is important, even if you plan on investing 100% of your money in the stock market.
We talked about this question on this week’s Ask the Compound:
Doug Boneparth joined me on the show this week to discuss questions about managing your finances in middle age, budgeting for RSUs, financial planning for families and how to allocate between investments and cash.
1Here’s what I used for each asset class here: S&P 500, S&P 600, S&P 400, MSCI EAFE and MSCI EM.
TORONTO – Canada’s main stock index was down more than 200 points in late-morning trading, weighed down by losses in the technology, base metal and energy sectors, while U.S. stock markets also fell.
The S&P/TSX composite index was down 239.24 points at 22,749.04.
In New York, the Dow Jones industrial average was down 312.36 points at 40,443.39. The S&P 500 index was down 80.94 points at 5,422.47, while the Nasdaq composite was down 380.17 points at 16,747.49.
The Canadian dollar traded for 73.80 cents US compared with 74.00 cents US on Thursday.
The October crude oil contract was down US$1.07 at US$68.08 per barrel and the October natural gas contract was up less than a penny at US$2.26 per mmBTU.
The December gold contract was down US$2.10 at US$2,541.00 an ounce and the December copper contract was down four cents at US$4.10 a pound.
This report by The Canadian Press was first published Sept. 6, 2024.
TORONTO – Canada’s main stock index was up more than 150 points in late-morning trading, helped by strength in technology, financial and energy stocks, while U.S. stock markets also pushed higher.
The S&P/TSX composite index was up 171.41 points at 23,298.39.
In New York, the Dow Jones industrial average was up 278.37 points at 41,369.79. The S&P 500 index was up 38.17 points at 5,630.35, while the Nasdaq composite was up 177.15 points at 17,733.18.
The Canadian dollar traded for 74.19 cents US compared with 74.23 cents US on Wednesday.
The October crude oil contract was up US$1.75 at US$76.27 per barrel and the October natural gas contract was up less than a penny at US$2.10 per mmBTU.
The December gold contract was up US$18.70 at US$2,556.50 an ounce and the December copper contract was down less than a penny at US$4.22 a pound.
This report by The Canadian Press was first published Aug. 29, 2024.
The crypto market has recently experienced a significant downturn, mirroring broader risk asset sell-offs. Over the past week, Bitcoin’s price dropped by 24%, reaching $53,000, while Ethereum plummeted nearly a third to $2,340. Major altcoins also suffered, with Cardano down 27.7%, Solana 36.2%, Dogecoin 34.6%, XRP 23.1%, Shiba Inu 30.1%, and BNB 25.7%.
The severe downturn in the crypto market appears to be part of a broader flight to safety, triggered by disappointing economic data. A worse-than-expected unemployment report on Friday marked the beginning of a technical recession, as defined by the Sahm Rule. This rule identifies a recession when the three-month average unemployment rate rises by at least half a percentage point from its lowest point in the past year.
Friday’s figures met this threshold, signaling an abrupt economic downshift. Consequently, investors sought safer assets, leading to declines in major stock indices: the S&P 500 dropped 2%, the Nasdaq 2.5%, and the Dow 1.5%. This trend continued into Monday with further sell-offs overseas.
The crypto market’s rapid decline raises questions about its role as either a speculative asset or a hedge against inflation and recession. Despite hopes that crypto could act as a risk hedge, the recent crash suggests it remains a speculative investment.
Since the downturn, the crypto market has seen its largest three-day sell-off in nearly a year, losing over $500 billion in market value. According to CoinGlass data, this bloodbath wiped out more than $1 billion in leveraged positions within the last 24 hours, including $365 million in Bitcoin and $348 million in Ether.
Khushboo Khullar of Lightning Ventures, speaking to Bloomberg, argued that the crypto sell-off is part of a broader liquidity panic as traders rush to cover margin calls. Khullar views this as a temporary sell-off, presenting a potential buying opportunity.
Josh Gilbert, an eToro market analyst, supports Khullar’s perspective, suggesting that the expected Federal Reserve rate cuts could benefit crypto assets. “Crypto assets have sold off, but many investors will see an opportunity. We see Federal Reserve rate cuts, which are now likely to come sharper than expected, as hugely positive for crypto assets,” Gilbert told Coindesk.
Despite the recent volatility, crypto continues to make strides toward mainstream acceptance. Notably, Morgan Stanley will allow its advisors to offer Bitcoin ETFs starting Wednesday. This follows more than half a year after the introduction of the first Bitcoin ETF. The investment bank will enable over 15,000 of its financial advisors to sell BlackRock’s IBIT and Fidelity’s FBTC. This move is seen as a significant step toward the “mainstreamization” of crypto, given the lengthy regulatory and company processes in major investment banks.
The recent crypto market downturn highlights its volatility and the broader economic concerns affecting all risk assets. While some analysts see the current situation as a temporary sell-off and a buying opportunity, others caution against the speculative nature of crypto. As the market evolves, its role as a mainstream alternative asset continues to grow, marked by increasing institutional acceptance and new investment opportunities.