adplus-dvertising
Connect with us

Economy

Visualizing the $105 Trillion World Economy in One Chart

Published

 on

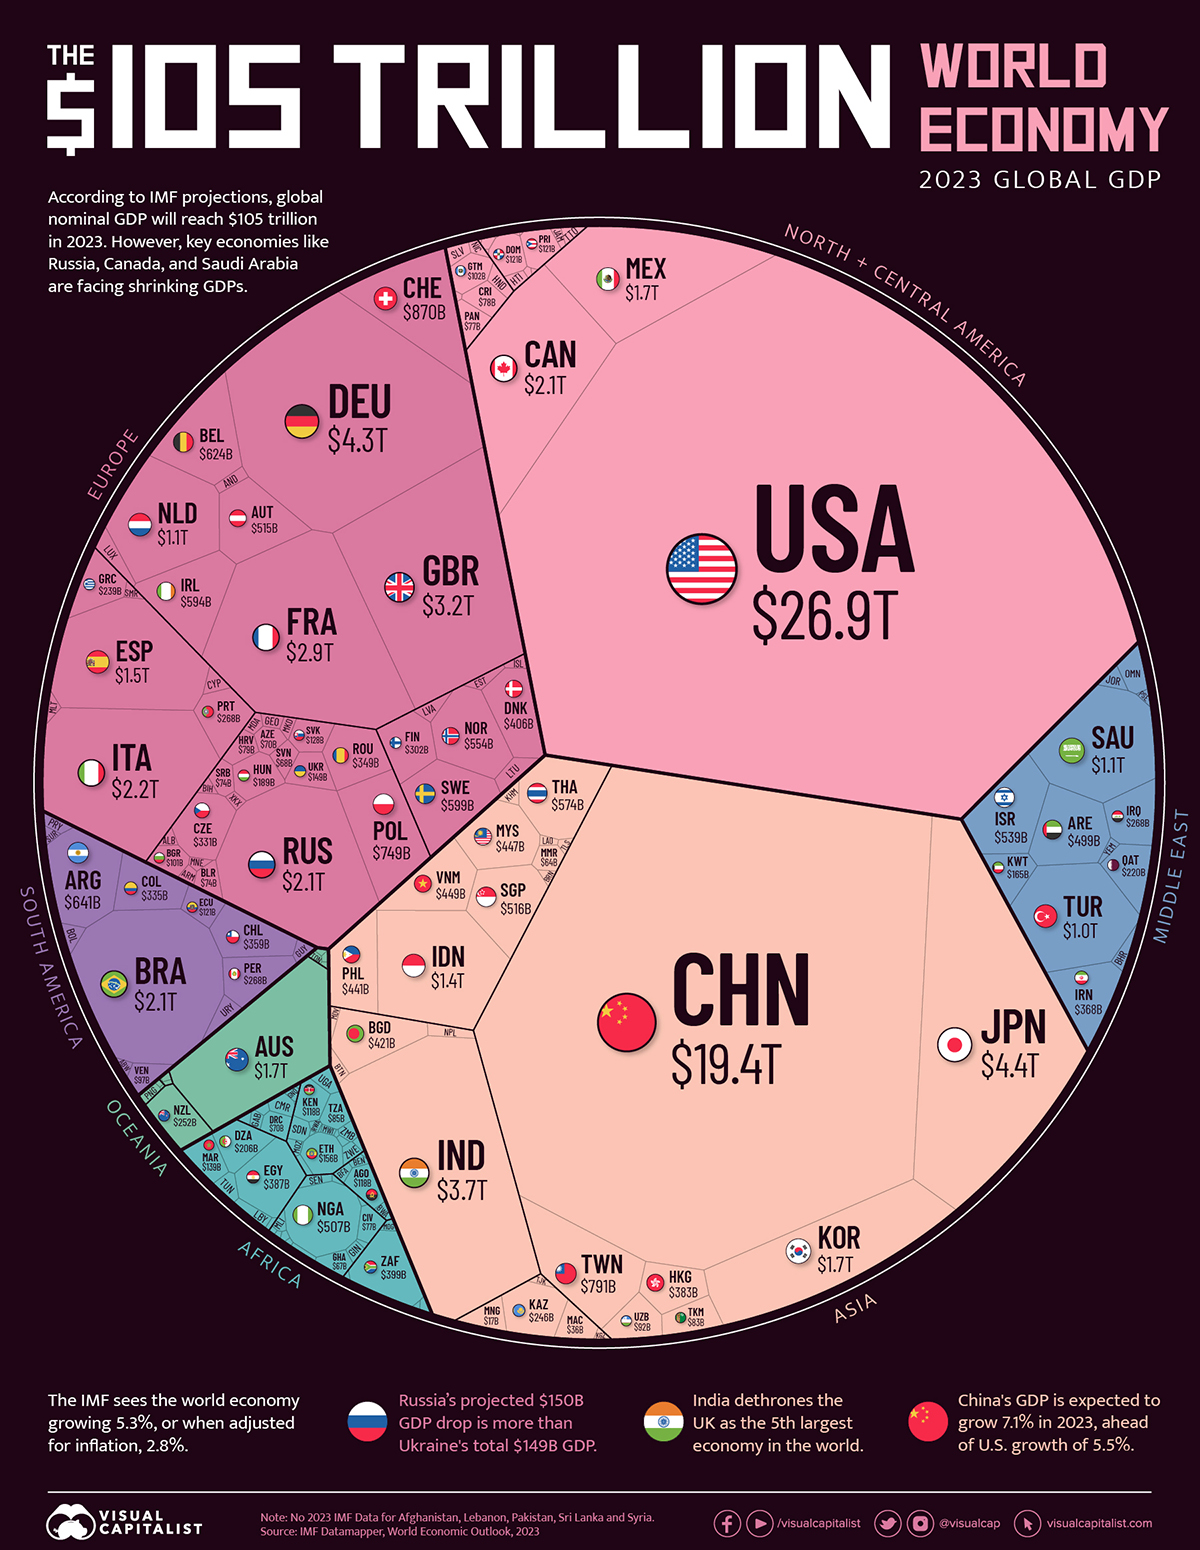
A chart showing the breakup of the world economy, organized by the size of each country's gross domestic product.


By the end of 2023, the world economy is expected to have a gross domestic product (GDP) of $105 trillion, or $5 trillion higher than the year before, according to the latest International Monetary Fund (IMF) projections from its 2023 World Economic Outlook report.

In nominal terms, that’s a 5.3% increase in global GDP. In inflation-adjusted terms, that would be a 2.8% increase.

ℹ️ Gross Domestic Product (GDP) measures the total value of economic output—goods and services—produced within a given time frame by both the private and public sectors. All numbers used in this article, unless otherwise specified, are nominal figures, and do not account for inflation.

The year started with turmoil for the global economy, with financial markets rocked by the collapse of several mid-sized U.S. banks alongside persistent inflation and tightening monetary conditions in most countries. Nevertheless, some economies have proven to be resilient, and are expected to register growth from 2022.

Ranking Countries by Economic Size in 2023

The U.S. is expected to continue being the biggest economy in 2023 with a projected GDP of $26.9 trillion for the year. This is more than the sum of the GDPs of 174 countries ranked from Indonesia (17th) to Tuvalu (191st).

China stays steady at second place with a projected $19.4 trillion GDP in 2023. Most of the top-five economies remain in the same positions from 2022, with one notable exception.

India is expected to climb past the UK to become the fifth-largest economy with a projected 2023 GDP of $3.7 trillion.

Here’s a look at the size of every country’s economy in 2023, according to IMF’s estimates.

Rank Country GDP (USD) % of Total
1 ???????? U.S. $26,855B 25.54%
2 ???????? China $19,374B 18.43%
3 ???????? Japan $4,410B 4.19%
4 ???????? Germany $4,309B 4.10%
5 ???????? India $3,737B 3.55%
6 ???????? UK $3,159B 3.00%
7 ???????? France $2,923B 2.78%
8 ???????? Italy $2,170B 2.06%
9 ???????? Canada $2,090B 1.99%
10 ???????? Brazil $2,081B 1.98%
11 ???????? Russia $2,063B 1.96%
12 ???????? South Korea $1,722B 1.64%
13 ???????? Australia $1,708B 1.62%
14 ???????? Mexico $1,663B 1.58%
15 ???????? Spain $1,492B 1.42%
16 ???????? Indonesia $1,392B 1.32%
17 ???????? Netherlands $1,081B 1.03%
18 ???????? Saudi Arabia $1,062B 1.01%
19 ???????? Türkiye $1,029B 0.98%
20 ???????? Switzerland $870B 0.83%
21 ???????? Taiwan $791B 0.75%
22 ???????? Poland $749B 0.71%
23 ???????? Argentina $641B 0.61%
24 ???????? Belgium $624B 0.59%
25 ???????? Sweden $599B 0.57%
26 ???????? Ireland $594B 0.57%
27 ???????? Thailand $574B 0.55%
28 ???????? Norway $554B 0.53%
29 ???????? Israel $539B 0.51%
30 ???????? Singapore $516B 0.49%
31 ???????? Austria $515B 0.49%
32 ???????? Nigeria $507B 0.48%
33 ???????? UAE $499B 0.47%
34 ???????? Vietnam $449B 0.43%
35 ???????? Malaysia $447B 0.43%
36 ???????? Philippines $441B 0.42%
37 ???????? Bangladesh $421B 0.40%
38 ???????? Denmark $406B 0.39%
39 ???????? South Africa $399B 0.38%
40 ???????? Egypt $387B 0.37%
41 ???????? Hong Kong $383B 0.36%
42 ???????? Iran $368B 0.35%
43 ???????? Chile $359B 0.34%
44 ???????? Romania $349B 0.33%
45 ???????? Colombia $335B 0.32%
46 ???????? Czech Republic $330B 0.31%
47 ???????? Finland $302B 0.29%
48 ???????? Peru $268B 0.26%
49 ???????? Iraq $268B 0.25%
50 ???????? Portugal $268B 0.25%
51 ???????? New Zealand $252B 0.24%
52 ???????? Kazakhstan $246B 0.23%
53 ???????? Greece $239B 0.23%
54 ???????? Qatar $220B 0.21%
55 ???????? Algeria $206B 0.20%
56 ???????? Hungary $189B 0.18%
57 ???????? Kuwait $165B 0.16%
58 ???????? Ethiopia $156B 0.15%
59 ???????? Ukraine $149B 0.14%
60 ???????? Morocco $139B 0.13%
61 ???????? Slovak
Republic
$128B 0.12%
62 ???????? Ecuador $121B 0.12%
63 ???????? Dominican
Republic
$121B 0.12%
64 ???????? Puerto Rico $121B 0.11%
65 ???????? Kenya $118B 0.11%
66 ???????? Angola $118B 0.11%
67 ???????? Oman $105B 0.10%
68 ???????? Guatemala $102B 0.10%
69 ???????? Bulgaria $101B 0.10%
70 ???????? Venezuela $97B 0.09%
71 ???????? Uzbekistan $92B 0.09%
72 ???????? Luxembourg $87B 0.08%
73 ???????? Tanzania $85B 0.08%
74 ???????? Turkmenistan $83B 0.08%
75 ???????? Croatia $79B 0.08%
76 ???????? Lithuania $78B 0.07%
77 ???????? Costa Rica $78B 0.07%
78 ???????? Uruguay $77B 0.07%
79 ???????? Panama $77B 0.07%
80 ???????? Côte d’Ivoire $77B 0.07%
81 ???????? Serbia $74B 0.07%
82 ???????? Belarus $74B 0.07%
83 ???????? Azerbaijan $70B 0.07%
84 ???????? DRC $69B 0.07%
85 ???????? Slovenia $68B 0.06%
86 ???????? Ghana $67B 0.06%
87 ???????? Myanmar $64B 0.06%
88 ???????? Jordan $52B 0.05%
89 ???????? Tunisia $50B 0.05%
90 ???????? Uganda $50B 0.05%
91 ???????? Cameroon $49B 0.05%
92 ???????? Latvia $47B 0.05%
93 ???????? Sudan $47B 0.04%
94 ???????? Libya $46B 0.04%
95 ???????? Bolivia $46B 0.04%
96 ???????? Bahrain $45B 0.04%
97 ???????? Paraguay $43B 0.04%
98 ???????? Nepal $42B 0.04%
99 ???????? Estonia $42B 0.04%
100 ???????? Macao $36B 0.03%
101 ???????? Honduras $34B 0.03%
102 ???????? El Salvador $34B 0.03%
103 ???????? Papua
New Guinea
$33B 0.03%
104 ???????? Senegal $31B 0.03%
105 ???????? Cyprus $31B 0.03%
106 ???????? Cambodia $31B 0.03%
107 ???????? Zimbabwe $30B 0.03%
108 ???????? Zambia $29B 0.03%
109 ???????? Iceland $29B 0.03%
110 ???????? Bosnia &
Herzegovina
$28B 0.03%
111 ???????? Trinidad
& Tobago
$28B 0.03%
112 ???????? Georgia $28B 0.03%
113 ???????? Haiti $27B 0.03%
114 ???????? Armenia $24B 0.02%
115 ???????? Guinea $23B 0.02%
116 ???????? Burkina Faso $21B 0.02%
117 ???????? Mali $21B 0.02%
118 ???????? Gabon $20B 0.02%
119 ???????? Albania $20B 0.02%
120 ???????? Mozambique $20B 0.02%
121 ???????? Botswana $20B 0.02%
122 ???????? Yemen $20B 0.02%
123 ???????? Malta $19B 0.02%
124 ???????? Benin $19B 0.02%
125 ???????? West Bank
& Gaza
$19B 0.02%
126 ???????? Nicaragua $17B 0.02%
127 ???????? Jamaica $17B 0.02%
128 ???????? Mongolia $17B 0.02%
129 ???????? Niger $17B 0.02%
130 ???????? Guyana $16B 0.02%
131 ???????? Madagascar $16B 0.02%
132 ???????? Moldova $16B 0.02%
133 ???????? Brunei Darussalam $16B 0.01%
134 ???????? North Macedonia $15B 0.01%
135 ???????? Equatorial Guinea $15B 0.01%
136 ???????? Mauritius $15B 0.01%
137 ???????? Bahamas $14B 0.01%
138 ???????? Laos $14B 0.01%
139 ???????? Namibia $13B 0.01%
140 ???????? Rwanda $13B 0.01%
141 ???????? Congo $13B 0.01%
142 ???????? Tajikistan $13B 0.01%
143 ???????? Kyrgyz Republic $12B 0.01%
144 ???????? Chad $12B 0.01%
145 ???????? Malawi $11B 0.01%
146 ???????? Mauritania $11B 0.01%
147 ???????? Kosovo $10B 0.01%
148 ???????? Togo $9B 0.01%
149 ???????? Somalia $9B 0.01%
150 ???????? Montenegro $7B 0.01%
151 ???????? South Sudan $7B 0.01%
152 ???????? Maldives $7B 0.01%
153 ???????? Barbados $6B 0.01%
154 ???????? Fiji $5B 0.01%
155 ???????? Eswatini $5B 0.00%
156 ???????? Liberia $4B 0.00%
157 ???????? Djibouti $4B 0.00%
158 ???????? Andorra $4B 0.00%
159 ???????? Aruba $4B 0.00%
160 ???????? Sierra Leone $4B 0.00%
161 ???????? Suriname $3B 0.00%
162 ???????? Burundi $3B 0.00%
163 ???????? Belize $3B 0.00%
164 ???????? Central
African Republic
$3B 0.00%
165 ???????? Bhutan $3B 0.00%
166 ???????? Eritrea $3B 0.00%
167 ???????? Lesotho $3B 0.00%
168 ???????? Cabo Verde $2B 0.00%
169 ???????? Gambia $2B 0.00%
170 ???????? Saint Lucia $2B 0.00%
171 ???????? East Timor $2B 0.00%
172 ???????? Seychelles $2B 0.00%
173 ???????? Guinea-Bissau $2B 0.00%
174 ???????? Antigua & Barbuda $2B 0.00%
175 ???????? San Marino $2B 0.00%
176 ???????? Solomon Islands $2B 0.00%
177 ???????? Comoros $1B 0.00%
178 ???????? Grenada $1B 0.00%
179 ???????? Vanuatu $1B 0.00%
180 ???????? Saint Kitts
& Nevis
$1B 0.00%
181 ???????? Saint Vincent
& the Grenadines
$1B 0.00%
182 ???????? Samoa $1B 0.00%
183 ???????? Dominica $1B 0.00%
184 ???????? São Tomé
& Príncipe
$1B 0.00%
185 ???????? Tonga $1B 0.00%
186 ???????? Micronesia $0.5B 0.00%
187 ???????? Marshall Islands $0.3B 0.00%
188 ???????? Palau $0.3B 0.00%
189 ???????? Kiribati $0.2B 0.00%
190 ???????? Nauru $0.2B 0.00%
191 ???????? Tuvalu $0.1B 0.00%


Note: Projections for Afghanistan, Lebanon, Pakistan, Sri Lanka and Syria are missing from IMF’s database for 2023.

Here are the largest economies for each region of the world.

  • Africa: Nigeria ($506.6 billion)
  • Asia: China ($19.4 trillion)
  • Europe: Germany ($4.3 trillion)
  • Middle East: Saudi Arabia ($1.1 trillion)
  • North & Central America: U.S. ($26.9 trillion)
  • Oceania: Australia ($1.7 trillion)
  • South America: Brazil ($2.1 trillion)

Ranked: 2023’s Shrinking Economies

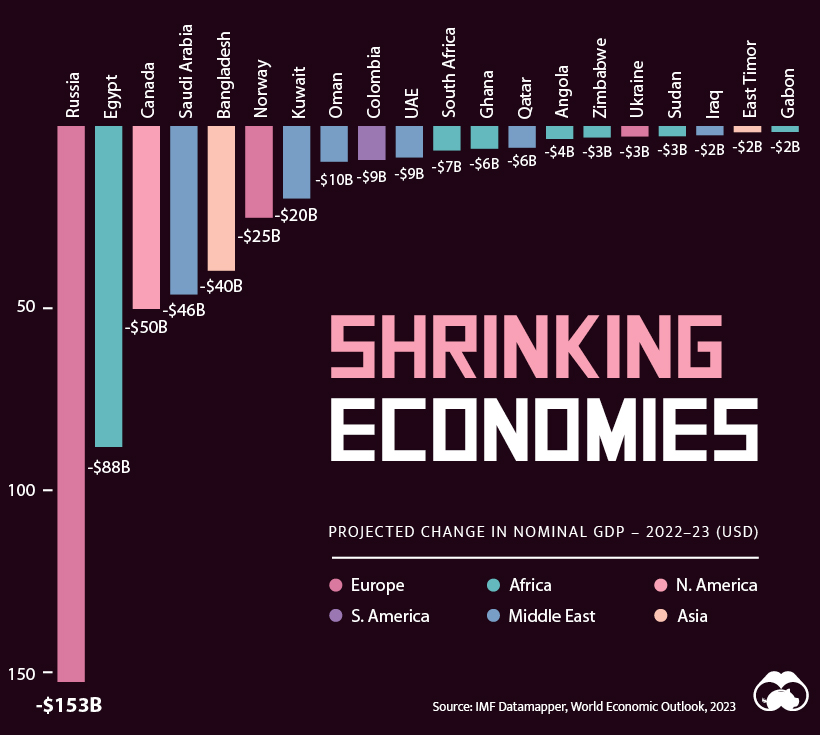
In fact, 29 economies are projected to shrink from their 2022 sizes, leading to nearly $500 billion in lost output.

A bar chart showing the amount of nominal GDP shrinkage for several countries.

Russia will see the biggest decline, with a projected $150 billion contraction this year. This is equal to about one-third of total decline of all 29 countries with shrinking economies.

Egypt (-$88 billion) and Canada (-$50 billion) combined make up another one-third of lost output.

In Egypt’s case, the drop can be partly explained by the country’s currency (Egyptian pound), which has dropped in value against the U.S. dollar by about 50% since mid-2022.

Russia and Canada are some of the world’s largest oil producers and the oil price has fallen since 2022. A further complication for Russia is that the country has been forced to sell oil at a steep discount because of Western sanctions.

Here are the projected changes in GDP for all countries facing year-over-year declines:

Country Region 2022–23 Change (USD) 2022–23 Change (%)
???????? Russia Europe -$152.65B -6.9%
???????? Egypt Africa -$88.12B -18.5%
???????? Canada North America -$50.17B -2.3%
???????? Saudi Arabia Middle East -$46.25B -4.2%
???????? Bangladesh Asia -$39.69B -8.6%
???????? Norway Europe -$25.16B -4.3%
???????? Kuwait Middle East -$19.85B -10.8%
???????? Oman Middle East -$9.77B -8.5%
???????? Colombia South America -$9.25B -2.7%
???????? UAE Middle East -$8.56B -1.7%
???????? South Africa Africa -$6.69B -1.6%
???????? Ghana Africa -$6.22B -8.5%
???????? Qatar Middle East -$5.91B -2.6%
???????? Angola Africa -$3.54B -2.9%
???????? Zimbabwe Africa -$3.09B -9.4%
???????? Ukraine Europe -$2.79B -1.8%
???????? Sudan Africa -$2.72B -5.5%
???????? Iraq Middle East -$2.47B -0.9%
???????? East Timor Asia -$1.67B -45.7%
???????? Gabon Africa -$1.60B -7.3%
???????? Equatorial Guinea Africa -$1.35B -8.2%
???????? Malawi Africa -$1.24B -9.9%
???????? Laos Asia -$1.21B -7.9%
???????? Brunei Asia -$1.13B -6.8%
???????? Yemen Middle East -$1.12B -5.4%
???????? South Sudan Africa -$0.86B -10.9%
???????? Burundi Africa -$0.66B -16.9%
???????? Sierra Leone Africa -$0.42B -10.6%
???????? Suriname South America -$0.05B -1.4%

The presence of Saudi Arabia, Norway, Kuwait, and Oman in the top 10 biggest GDP contractions further highlights the potential impact on GDP for oil-producing countries, according to the IMF’s projections.

More recently, producers have been cutting supply in an effort to boost prices, but concerns of slowing global oil demand in the wake of a subdued Chinese economy (the world’s second-largest oil consumer), have kept oil prices lower than in 2022 regardless.

The Footnote on GDP Forecasts

While organizations like the IMF have gotten fairly good at GDP forecasting, it’s still worth remembering that these are projections and assumptions made at the beginning of the year that may not hold true by the end of 2023.

For example, JP Morgan has already changed their forecast for China’s 2023 real GDP growth six times in as many months after expectations of broad-based pandemic-recovery spending did not materialize in the country.

The key takeaway from IMF’s projections for 2023 GDP growth rests on how well countries restrict inflation without stifling growth, all amidst tense liquidity conditions.

Where Does This Data Come From?

Source: The International Monetary Fund’s Datamapper which uses projections made in the April 2023 World Economic Outlook report.

Note: Projections for Afghanistan, Lebanon, Pakistan, Sri Lanka and Syria are missing from the IMF’s database. Furthermore, all figures used in the article, unless specified, are nominal GDP numbers and rates.

Adblock test (Why?)

728x90x4

Source link

Continue Reading

Economy

Vladimir Putin is in a painful economic bind – The Economist

Published

 on


[unable to retrieve full-text content]

Vladimir Putin is in a painful economic bind  The Economist

728x90x4

Source link

Continue Reading

Economy

Which items will be tax-free under the Liberals’ promised GST/HST break?

Published

 on


The government on Thursday announced a sweeping promise to make groceries, children’s clothing, Christmas trees, restaurant meals and more free from GST/HST between Dec. 14 and Feb. 15.

“Our government can’t set prices at checkout, but we can put more money in people’s pockets,” Trudeau said at a press conference announcing the measures.

The government says removing GST from these goods for a two-month period would save $100 for a family that spends $2,000 on those goods during that time. For those in provinces with HST, a family spending $2,000 would save $260.

Thursday’s announcement also included a rebate for Canadians who worked in 2023 and made less than $150,000, totalling $250 per person.

Here are the items that will be GST/HST-free if the Liberals’ legislation passes.

Groceries

Many grocery items are already tax-free. The Canada Revenue Agency considers most food and beverages to be “basic” grocery items, such as produce, bread, cereal, canned and frozen food, eggs, coffee, milk, and meat.

However, certain categories, like carbonated drinks, candies and snack foods, are taxed.

The government’s tax break will apply to certain items that normally are subject to tax.

These include prepared foods such as vegetable trays and pre-made meals, as well as snacks such as chips, candy and granola bars.

Carbonated beverages, water bottles fruit juices and juice crystals are included, as are ice cream products and baked desserts like cakes and pies.

The government says its tax break will mean “essentially all food” will be GST/HST-free.

Alcohol

The tax break will also apply to alcoholic beverages below seven per cent alcohol by volume, including beer, wine, cider, and pre-mixed drinks.

Normally, all alcoholic drinks are taxed.

Restaurants

Restaurant meals will also be subject to the tax break. It will apply whether you’re dining in, taking food to go, or ordering delivery.

Children’s items

Children’s clothing, including baby bibs, socks, hats and footwear, will qualify for the tax break. So will children’s diapers and car seats.

Children’s footwear and clothing used exclusively for sports or recreational activities will not be included in the tax break. This includes costumes.

Children’s toys will be included in the tax break as long as they’re designed for use by children under 14 years old. These could include board games, dolls, card games, Lego, Plasticine and teddy bears.

Printed goods

Print newspapers will be included in the tax break, but electronic or digital publications will not.

Most flyers, magazines, inserts and periodicals will be excluded.

Printed books will be included in the tax break, including religious scripture. Audio books where 90 per cent or more of the recording is a reading of a printed book are included.

Printed items that aren’t subject to the tax break include magazines where advertisements take up more than five per cent of total printed space, sales catalogues and brochures, books designed for writing on, event programs, agendas and directories.

Other

Christmas trees, natural or artificial, will be included in the tax break.

Puzzles and video game consoles are also included.

This report by The Canadian Press was first published Nov. 21, 2024.

Source link

Continue Reading

Economy

In Russia's War Economy, The Warning Lights Are Blinking – Radio Free Europe / Radio Liberty

Published

 on


[unable to retrieve full-text content]

In Russia’s War Economy, The Warning Lights Are Blinking  Radio Free Europe / Radio Liberty

728x90x4

Source link

Continue Reading

Trending