Even with a new president and political party soon in charge of the White House, the nation’s economic standoff continues. Notwithstanding President-elect Joe Biden’s solid popular vote victory, last week’s election failed to deliver the kind of transformative reorientation of the nation’s political-economic map that Democrats (and some Republicans) had hoped for. The data confirms that the election sharpened the striking geographic divide between red and blue America, instead of dispelling it.
Most notably, the stark economic rift that Brookings Metro documented after Donald Trump’s shocking 2016 victory has grown even wider. In 2016, we wrote that the 2,584 counties that Trump won generated just 36% of the country’s economic output, whereas the 472 counties Hillary Clinton carried equated to almost two-thirds of the nation’s aggregate economy.
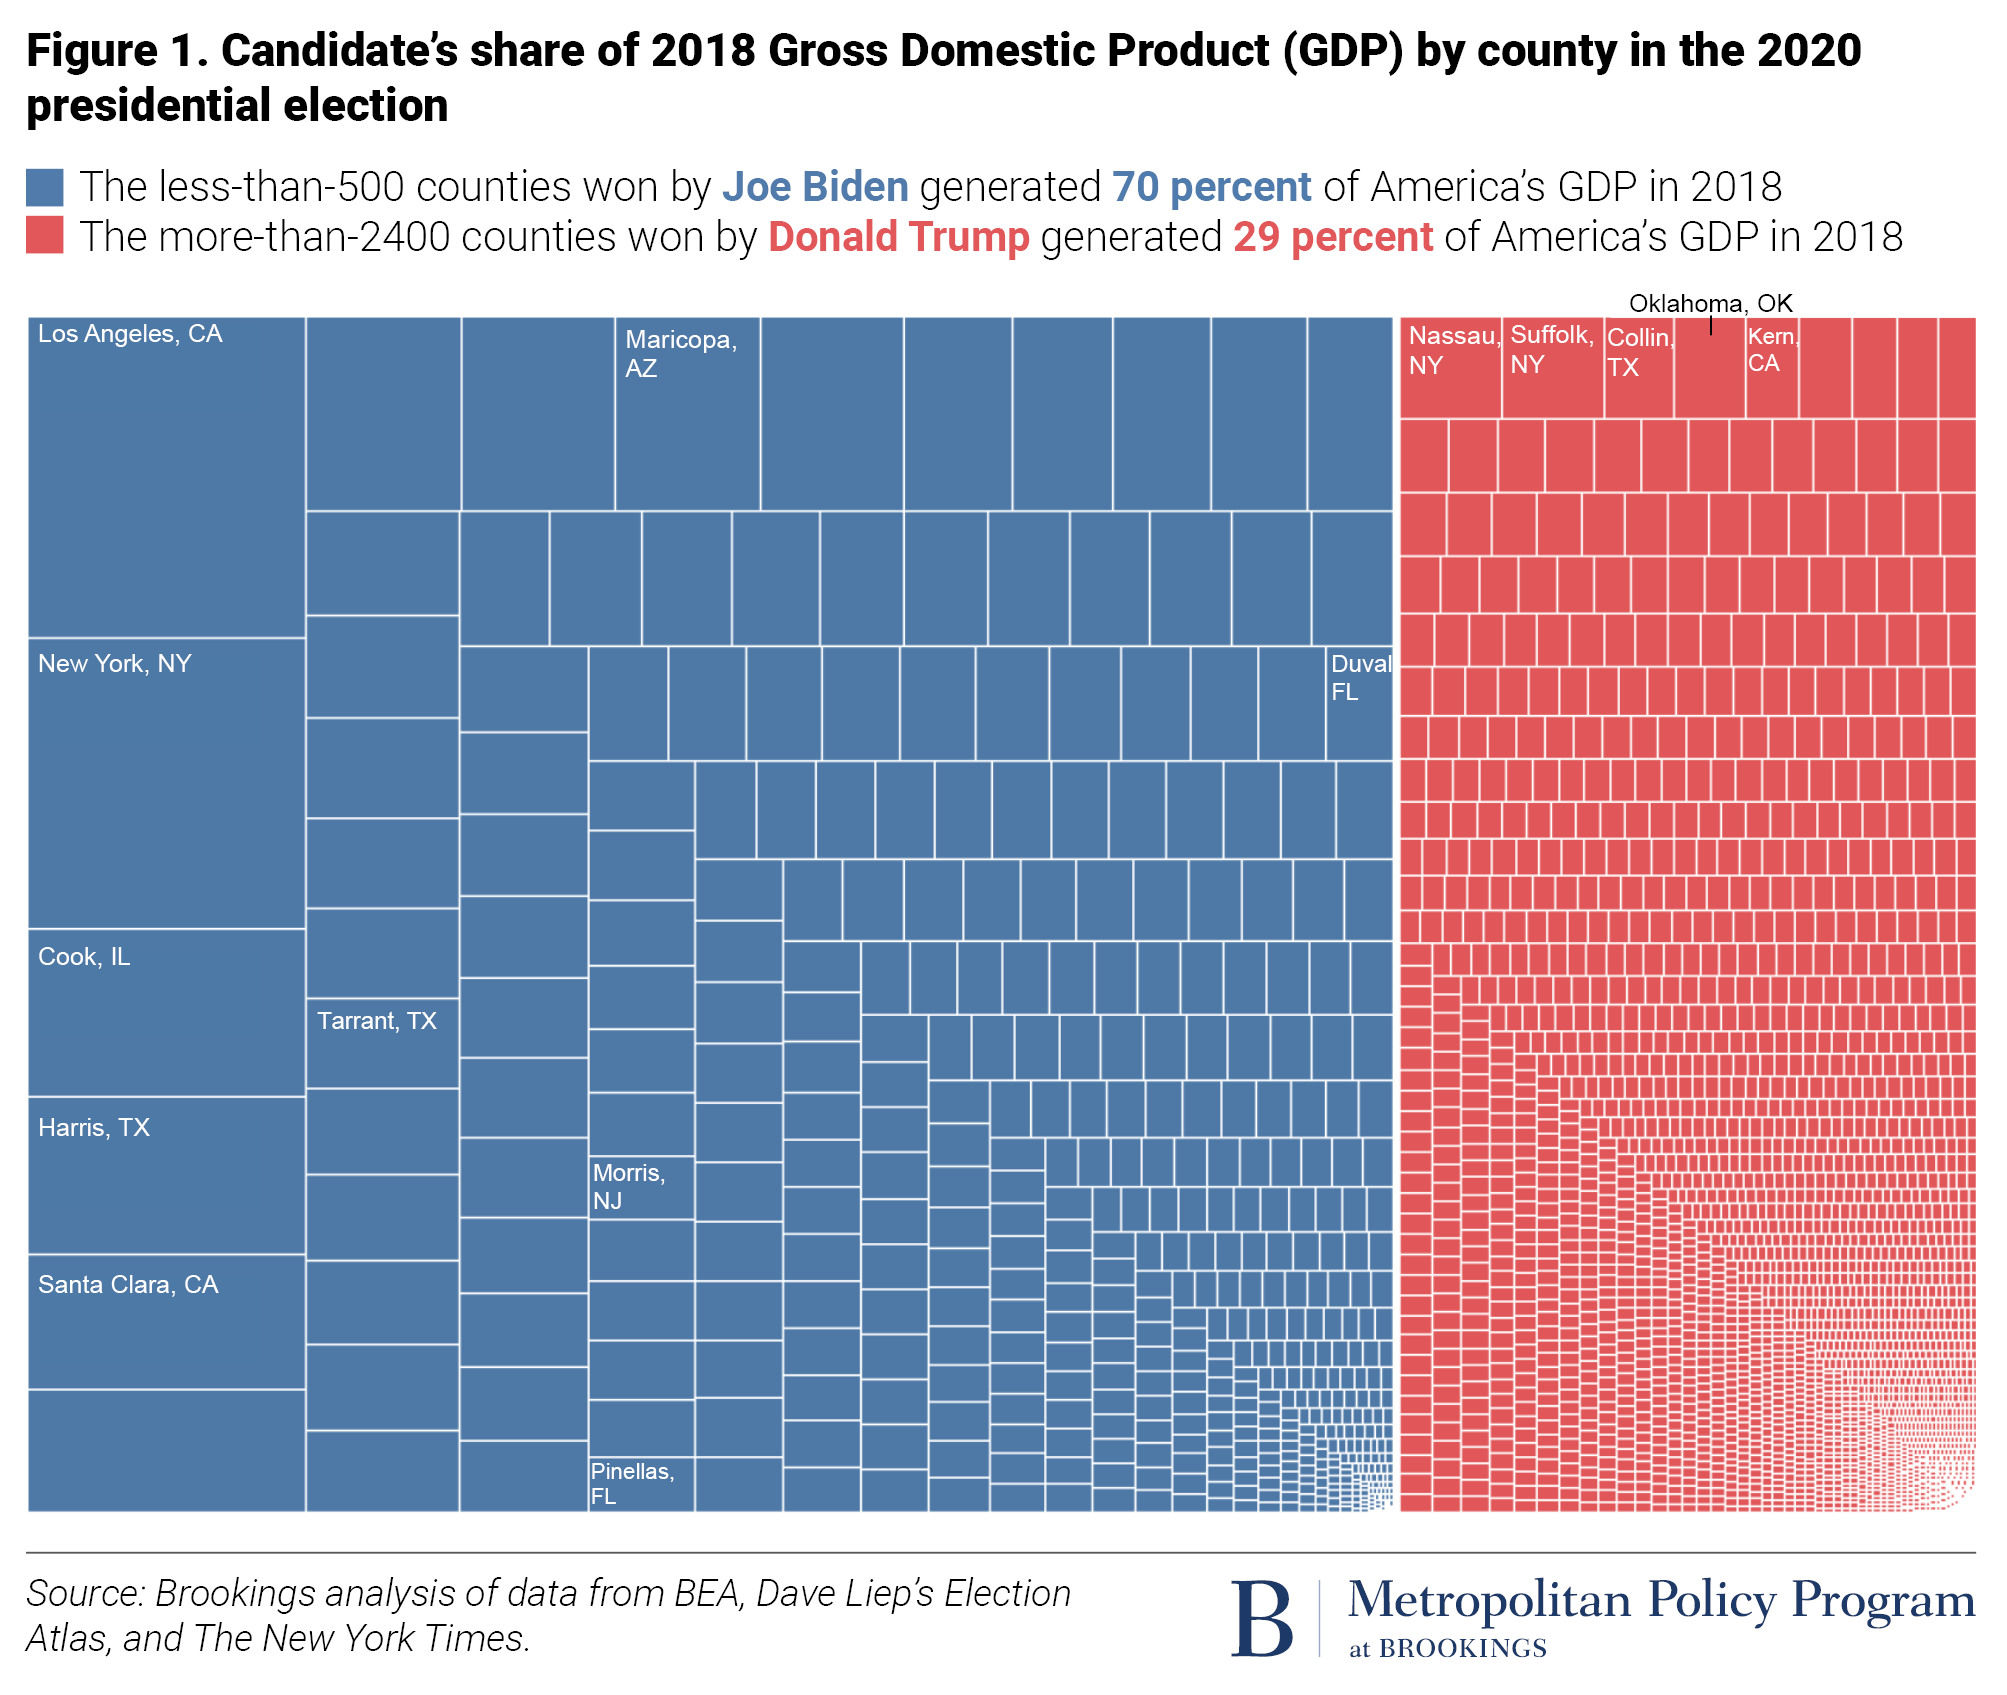
A similar analysis for last week’s election shows these trends continuing, albeit with a different political outcome. This time, Biden’s winning base in 477 counties encompasses fully 70% of America’s economic activity, while Trump’s losing base of 2,497 counties represents just 29% of the economy. (Votes are still outstanding in 110 mostly low-output counties, and this piece will be updated as new data is reported.)
Table 1. Candidates’ counties won and share of GDP in 2016 and 2020
Year
Candidate
Counties won
Total votes
Aggregate share of US GDP
2016
Hillary Clinton
472
65,853,625
64%
Donald Trump
2,584
62,985,106
36%
2020
Joe Biden
477
75,602,458
70%
Donald Trump
2,497
71,216,709
29%
Note: 2020 figures reflect unofficial results from 96% of counties
Source: Brookings analysis of data from the Bureau of Economic Analysis, Dave Leip’s Atlas of U.S. Presidential Elections, The New York Times, and Moody’s Analytics
So, while the election’s winner may have changed, the nation’s economic geography remains rigidly divided. Biden captured virtually all of the counties with the biggest economies in the country (depicted by the largest blue tiles in the nearby graphic), including flipping the few that Clinton did not win in 2016.
By contrast, Trump won thousands of counties in small-town and rural communities with correspondingly tiny economies (depicted by the red tiles). Biden’s counties tended to be far more diverse, educated, and white-collar professional, with their aggregate nonwhite and college-educated shares of the economy running to 35% and 36%, respectively, compared to 16% and 25% in counties that voted for Trump.
In short, 2020’s map continues to reflect a striking split between the large, dense, metropolitan counties that voted Democratic and the mostly exurban, small-town, or rural counties that voted Republican. Blue and red America reflect two very different economies: one oriented to diverse, often college-educated workers in professional and digital services occupations, and the other whiter, less-educated, and more dependent on “traditional” industries.
With that said, it would be wrong to describe this as a completely static map. While the metropolitan/ nonmetropolitan dichotomy remained starkly persistent, 2020 election returns produced nontrivial movement, as Biden added modestly to the Democrats’ metropolitan base and significantly to its vote base. Most notably, Biden flipped seven of the nation’s 100 highest-output counties, strengthening the link between these core economic hubs and the Democratic Party. More specifically, Biden flipped half of the 10 most economically significant counties Trump won in 2016, including Phoenix’s Maricopa County; Dallas-Fort Worth’s Tarrant County; Jacksonville, Fla.’s Duval County; Morris County in New Jersey; and Tampa-St. Petersburg, Fla.’s Pinellas County.
Altogether, those losses shaved about 3 percentage points’ worth of GDP off the economic base of Trump counties. That reduced the share of the nation’s GDP produced by Republican-voting counties to a new low in recent times.
Why does this matter? This economic rift that persists in dividing the nation is a problem because it underscores the near-certainty of both continued clashes between the political parties and continued alienation and misunderstandings.
To start with, the 2020’s sharpened economic divide forecasts gridlock in Congress and between the White House and Senate on the most important issues of economic policy. The problem—as we have witnessed over the past decade and are likely to continue seeing—is not only that Democrats and Republicans disagree on issues of culture, identity, and power, but that they represent radically different swaths of the economy. Democrats represent voters who overwhelmingly reside in the nation’s diverse economic centers, and thus tend to prioritize housing affordability, an improved social safety net, transportation infrastructure, and racial justice. Jobs in blue America also disproportionately rely on national R&D investment, technology leadership, and services exports.
By contrast, Republicans represent an economic base situated in the nation’s struggling small towns and rural areas. Prosperity there remains out of reach for many, and the party sees no reason to consider the priorities and needs of the nation’s metropolitan centers. That is not a scenario for economic consensus or achievement.
At the same time, the results from last week’s election likely underscore fundamental problems of economic alienation and estrangement. Specifically, Trump’s anti-establishment appeal suggests that a sizable portion of the country continues to feel little connection to the nation’s core economic enterprises, and chose to channel that animosity into a candidate who promised not to build up all parts of the country, but rather to vilify groups who didn’t resemble his base.
If this pattern continues—with one party aiming to confront the challenges at top of mind for a majority of Americans, and the other continuing to stoke the hostility and indignation held by a significant minority—it will be a recipe not only for more gridlock and ineffective governance, but also for economic harm to nearly all people and places. In light of the desperate need for a broad, historic recovery from the economic damage of the COVID-19 pandemic, a continuation of the patterns we’ve seen play out over the past decade would be a particularly unsustainable situation for Americans in communities of all sizes.
OTTAWA – Bank of Canada governor Tiff Macklem says there is a lot of uncertainty around how artificial intelligence could affect the economy moving forward, including the labour market and price growth.
In a speech in Toronto at the Economics of Artificial Intelligence Conference, the governor said Friday that the central bank is approaching the issue cautiously to get a better understanding of how AI could affect its job of keeping inflation low and stable.
“Be wary of anyone who claims to know where AI will take us. There is too much uncertainty to be confident,” Macklem said in prepared remarks.
“We don’t know how quickly AI will continue to advance. And we don’t know the timing and extent of its economic and social impacts.”
The governor said AI has the potential of increasing labour productivity, which would raise living standards and grow the economy without boosting inflation.
In the short-term, he said investment in AI is adding to demand and could be inflationary.
However, Macklem also highlighted more pessimistic scenarios, where AI could destroy more jobs than it creates or lead to less competition rather than more.
The governor called on academics and businesses to work together to shed more light on the potential effects of AI on the economy.
“When you enter a dark room, you don’t go charging in. You cautiously feel your way around. And you try to find the light switch. That is what we are doing. What we central bankers need is more light,” he said.
This report by The Canadian Press was first published Sept. 20, 2024.
Almost seven years since news broke of an alleged conspiracy to fix the price of packaged bread across Canada, the saga isn’t over: the Competition Bureau continues to investigate the companies that may have been involved, and two class-action lawsuits continue to work their way through the courts.
Here’s a timeline of key events in the bread price-fixing case.
Oct. 31, 2017: The Competition Bureau says it’s investigating allegations of bread price-fixing and that it was granted search warrants in the case. Several grocers confirm they are co-operating in the probe.
Dec. 19, 2017: Loblaw and George Weston say they participated in an “industry-wide price-fixing arrangement” to raise the price of packaged bread. The companies say they have been co-operating in the Competition Bureau’s investigation since March 2015, when they self-reported to the bureau upon discovering anti-competitive behaviour, and are receiving immunity from prosecution. They announce they are offering $25 gift cards to customers amid the ongoing investigation into alleged bread price-fixing.
Jan. 31, 2018: In court documents, the Competition Bureau says at least $1.50 was added to the price of a loaf of bread between about 2001 and 2016.
Dec. 20, 2019: A class-action lawsuit in a Quebec court against multiple grocers and food companies is certified against a number of companies allegedly involved in bread price-fixing, including Loblaw, George Weston, Metro, Sobeys, Walmart Canada, Canada Bread and Giant Tiger (which have all denied involvement, except for Loblaw and George Weston, which later settled with the plaintiffs).
Dec. 31, 2021: A class-action lawsuit in an Ontario court covering all Canadian residents except those in Quebec who bought packaged bread from a company named in the suit is certified against roughly the same group of companies.
June 21, 2023: Bakery giant Canada Bread Co. is fined $50 million after pleading guilty to four counts of price-fixing under the Competition Act as part of the Competition Bureau’s ongoing investigation.
Oct. 25 2023: Canada Bread files a statement of defence in the Ontario class action denying participating in the alleged conspiracy and saying any anti-competitive behaviour it participated in was at the direction and to the benefit of its then-majority owner Maple Leaf Foods, which is not a defendant in the case (neither is its current owner Grupo Bimbo). Maple Leaf calls Canada Bread’s accusations “baseless.”
Dec. 20, 2023: Metro files new documents in the Ontario class action accusing Loblaw and its parent company George Weston of conspiring to implicate it in the alleged scheme, denying involvement. Sobeys has made a similar claim. The two companies deny the allegations.
July 25, 2024: Loblaw and George Weston say they agreed to pay a combined $500 million to settle both the Ontario and Quebec class-action lawsuits. Loblaw’s share of the settlement includes a $96-million credit for the gift cards it gave out years earlier.
Sept. 12, 2024: Canada Bread files new documents in Ontario court as part of the class action, claiming Maple Leaf used it as a “shield” to avoid liability in the alleged scheme. Maple Leaf was a majority shareholder of Canada Bread until 2014, and the company claims it’s liable for any price-fixing activity. Maple Leaf refutes the claims.
This report by The Canadian Press was first published Sept. 19, 2024.
Companies in this story: (TSX:L, TSX:MFI, TSX:MRU, TSX:EMP.A, TSX:WN)
TORONTO – Canada’s main stock index was up more than 250 points in late-morning trading, led by strength in the base metal and technology sectors, while U.S. stock markets also charged higher.
The S&P/TSX composite index was up 254.62 points at 23,847.22.
In New York, the Dow Jones industrial average was up 432.77 points at 41,935.87. The S&P 500 index was up 96.38 points at 5,714.64, while the Nasdaq composite was up 486.12 points at 18,059.42.
The Canadian dollar traded for 73.68 cents US compared with 73.58 cents US on Thursday.
The November crude oil contract was up 89 cents at US$70.77 per barrel and the October natural gas contract was down a penny at US2.27 per mmBTU.
The December gold contract was up US$9.40 at US$2,608.00 an ounce and the December copper contract was up four cents at US$4.33 a pound.
This report by The Canadian Press was first published Sept. 19, 2024.