adplus-dvertising
Connect with us

Science

Groundbreaking 3D Map of Cosmic Superbubble’s Magnetic Field Unveiled

Published

 on

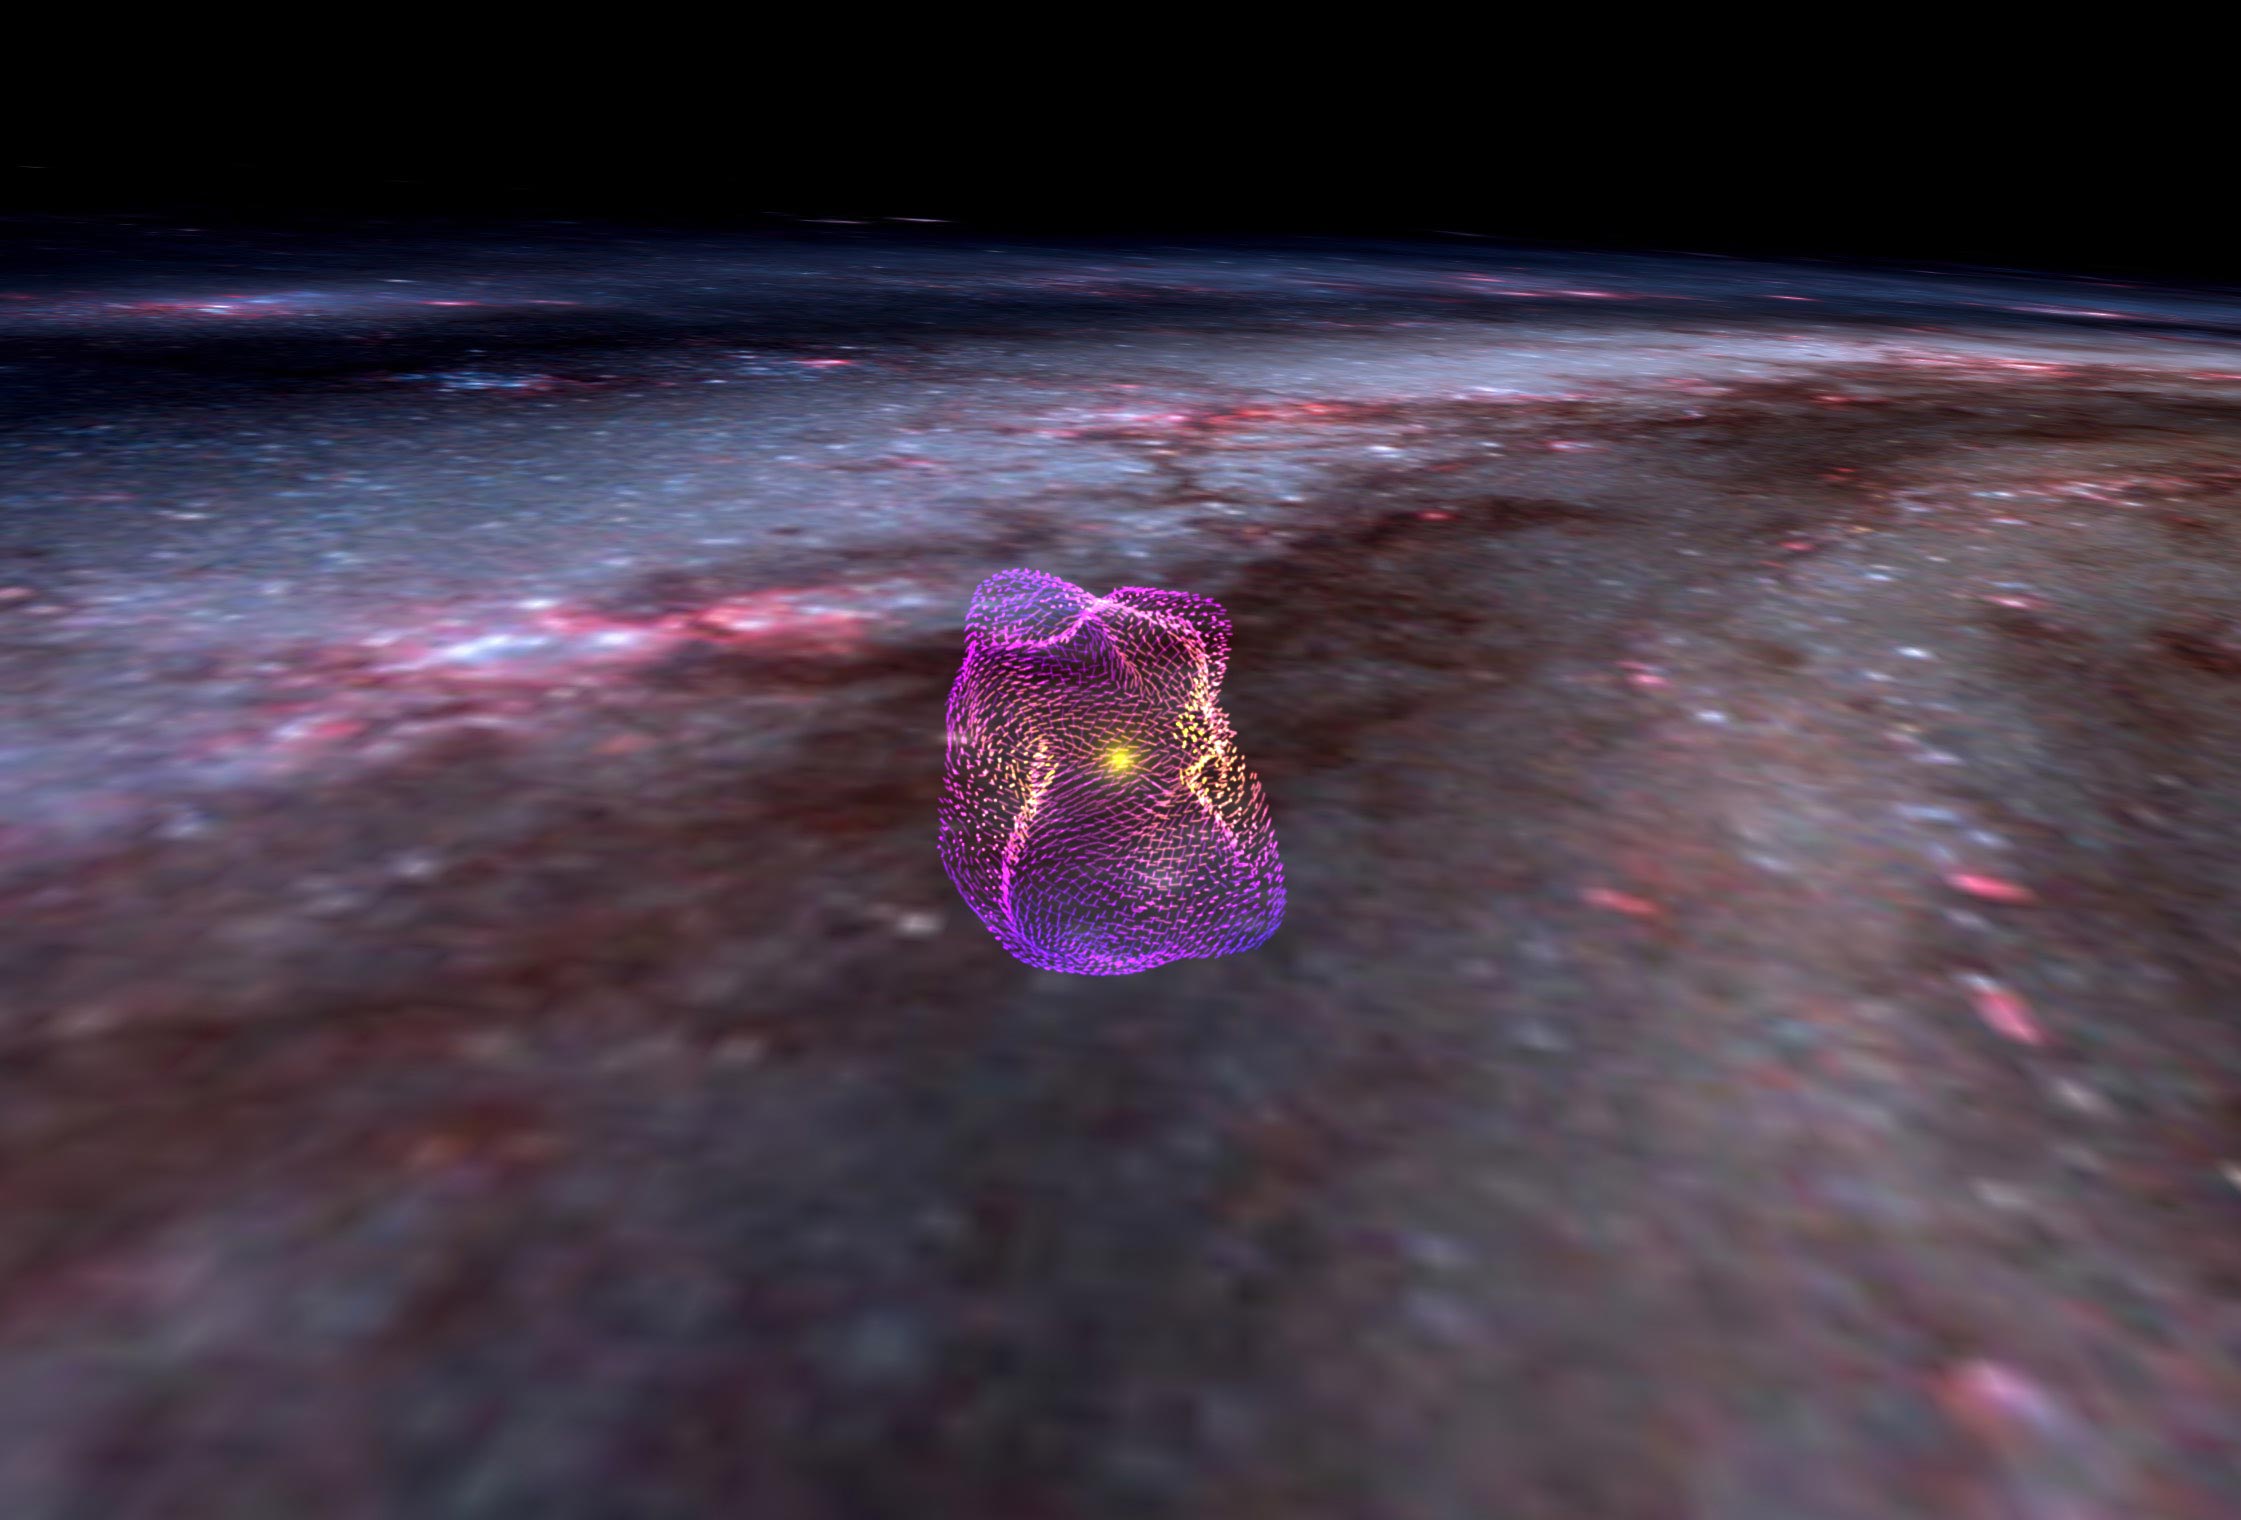
Astronomers have charted the magnetic field of the Local Bubble using data obtained by Planck and Gaia. Here, the short pink and purple vector lines on the surface of the bubble represent the orientation of the magnetic field discovered. The bubble sits within the Milky Way galaxy. Credit: Theo O’Neill / World Wide Telescope


Cosmic Superbubble’s Magnetic Field Charted in 3D for the First Time

A first-of-its-kind map that could help answer decades-old questions about the origins of stars and the influences of magnetic fields in the cosmos has been unveiled by astronomers at the Center for Astrophysics | Harvard & Smithsonian (<span class=”glossaryLink” aria-describedby=”tt” data-cmtooltip=”

CfA
The Harvard-Smithsonian Center for Astrophysics (CfA) is a joint venture between the Smithsonian Astrophysical Observatory and the Harvard College Observatory. Founded in 1973, the Harvard-Smithsonian Center for Astrophysics is comprised of six research divisions: Atomic and Molecular Physics; Optical and Infrared Astronomy; High Energy Astrophysics; Radio and Geoastronomy; Stellar, Solar, and Planetary Sciences; and Theoretical Astrophysics.

” data-gt-translate-attributes=”[“attribute”:”data-cmtooltip”, “format”:”html”]”>CfA).

The map reveals the likely magnetic field structure of the Local Bubble — a giant, 1,000-<span class=”glossaryLink” aria-describedby=”tt” data-cmtooltip=”

light-year
A light year is the distance that a particle of light (photon) will travel in a year—about 10 trillion kilometers (6 trillion miles). It is a useful unit for measuring distances between stars.

” data-gt-translate-attributes=”[“attribute”:”data-cmtooltip”, “format”:”html”]”>light-year-wide hollow in space surrounding our Sun. Like a hunk of Swiss cheese, our galaxy is full of these so-called superbubbles. The explosive supernova deaths of massive stars blow up these bubbles, and in the process, concentrate gas and dust — the fuel for making new stars — on the bubbles’ outer surfaces. These thick surfaces accordingly serve as rich sites for subsequent star and planet formation.


Scientists’ overall understanding of superbubbles, however, remains incomplete. With the new 3D magnetic field map, researchers now have novel information that could better explain the evolution of superbubbles, their effects on star formation and on galaxies writ large.


Scientists have unveiled the first-of-its-kind map of a magnetic field in space. Specifically, the team has charted the magnetic field of our Local Bubble in 3D. The new strategy for tracing magnetized structures in 3D will help address key questions about the influence of magnetic fields in the cosmos. Credit: T. O’Neill, A. Goodman, J. Soler, J. Han and C. Zucker

“Putting together this 3D map of the Local Bubble will help us examine superbubbles in new ways,” says Theo O’Neill, who led the mapmaking effort during a 10-week, NSF-sponsored summer research experience at the CfA while still an undergraduate at the University of Virginia (UVA).


“Space is full of these superbubbles that trigger the formation of new stars and planets and influence the overall shapes of galaxies,” continues O’Neill, who graduated from UVA in December 2022 with a degree in astronomy-physics and statistics. “By learning more about the exact mechanics that drive the Local Bubble, in which the Sun lives today, we can learn more about the evolution and dynamics of superbubbles in general.”

Along with colleagues, O’Neill presented the findings at the American Astronomical Society’s 241st annual meeting on Wednesday, Jan. 11, in Seattle, Washington. 3D interactive figures and a pre-print of the research are currently available on Authorea. The research was conducted at CfA under the mentorship of Harvard professor and CfA astronomer Alyssa Goodman, in collaboration with Catherine Zucker, a Harvard PhD astronomy alumna, Jesse Han, a Harvard PhD student and Juan Soler, a magnetic field expert in Rome.

“From a basic physics standpoint, we’ve long known that magnetic fields must play important roles in many astrophysical phenomena,” says Goodman, who wrote her PhD thesis on the importance of cosmic magnetic fields thirty years ago. “But studying these magnetic fields has been notoriously difficult. The difficulty perpetually drives me away from magnetic field work, but then new observational tools, computational methods and enthusiastic colleagues tempt me back in. Today’s computer simulations and all-sky surveys may just finally be good enough to start really incorporating magnetic fields into our broader picture of how the universe works, from the motions of tiny dust grains on up to the dynamics of galaxy clusters.”

The Local Bubble has emerged as a hot topic in astrophysics by virtue of being the superbubble in which the Sun and our Solar System now find themselves. In 2020, the Local Bubble’s 3D geometry was initially worked out by researchers based in Greece and France. Then in 2021, Zucker, now of Space Telescope Science Institute, Goodman, João Alves of the University of Vienna, and their team showed that the Local Bubble’s surface is the source of all nearby, young stars.


Those studies, along with the new 3D magnetic field map, have relied on data in part from Gaia, a space-based observatory launched by the European Space Agency (ESA). While measuring the positions and motions of stars, Gaia was used to infer the location of cosmic dust as well, charting its local concentrations and showing the approximate boundaries of the Local Bubble.

These data were combined by O’Neill and colleagues with data from Planck, another ESA-led space telescope. Planck, which carried out an all-sky survey from 2009 to 2013, was primarily designed to observe the <span class=”glossaryLink” aria-describedby=”tt” data-cmtooltip=”

Big Bang
The Big Bang is the leading cosmological model explaining how the universe as we know it began approximately 13.8 billion years ago.

” data-gt-translate-attributes=”[“attribute”:”data-cmtooltip”, “format”:”html”]”>Big Bang’s relic light. In the process, the spacecraft compiled measurements of microwave wavelength light from all over the sky. The researchers used a portion of Planck observations that trace emission from dust within the <span class=”glossaryLink” aria-describedby=”tt” data-cmtooltip=”

Milky Way
The Milky Way is the galaxy that contains our Solar System, and is named for its appearance from Earth. It is a barred spiral galaxy that contains an estimated 100-400 billion stars and has a diameter between 150,000 and 200,000 light-years.

” data-gt-translate-attributes=”[“attribute”:”data-cmtooltip”, “format”:”html”]”>Milky Way relevant to helping map the Local Bubble’s magnetic field.

Specifically, the observations of interest consisted of polarized light, meaning light that vibrates in a preferred direction. This polarization is produced by magnetically aligned dust particles in space. The alignment of the dust in turn speaks to the orientation of the magnetic field acting upon the dust particles.

Mapping the magnetic field lines in this way enabled researchers working on the Planck data to compile a 2D map of the magnetic field projected on to the sky as seen from Earth. In order to morph or “de-project” this map into three spatial dimensions, the researchers made two key assumptions: First, that most of the interstellar dust producing the polarization observed lies in the Local Bubble’s surface. And, second, that theories predicting that the magnetic field would be “swept up” into the bubble’s surface as it expands are correct.


O’Neill subsequently carried out the complicated geometrical analysis needed to create the 3D magnetic field map during the summer CfA internship.

Goodman likens the research team to pioneering mapmakers who created some of the first maps of Earth.

“We’ve made some big assumptions to create this first 3D map of a magnetic field; it’s by no means a perfect picture,” she says. “As technology and our physical understanding improve, we will be able to improve the <span class=”glossaryLink” aria-describedby=”tt” data-cmtooltip=”

accuracy
How close the measured value conforms to the correct value.

” data-gt-translate-attributes=”[“attribute”:”data-cmtooltip”, “format”:”html”]”>accuracy of our map and hopefully confirm what we are seeing.”

The 3D view of magnetic whorls that emerged represent the magnetic field structure of our neighborhood superbubble, if the field was indeed swept-up into the bubble’s surface, and if most of the polarization is produced there.


The research team further compared the resulting map to features along the Local Bubble’s surface. Examples included the Per-Tau Shell, a giant spherical region of star formation, and the Orion molecular cloud complex, another prominent stellar nursery. Future studies will examine the associations between magnetic fields and these and other surface features.

“With this map, we can really start to probe the influences of magnetic fields on star formation in superbubbles,” says Goodman. “And for that matter, get a better grasp on how these fields influence numerous other cosmic phenomena.”

Because magnetic fields only affect the movement and orientation of charged particles in astrophysical environments, Goodman says there has been a tendency to set aside the fields’ influence when building simulations and theories where gravity — which acts on all matter — is the primary force at play. Further discouraging its inclusion, magnetism can be a fiendishly complex force to model.

This omission of magnetic fields’ influence, while understandable, often leaves out a key factor controlling motions of gas in the universe. These motions include gas flowing onto stars as they form, and flowing away from stars in powerful jets emanating from them as they gather matter into a planet-forming disk. Even if the effect of magnetic fields is minuscule from moment to moment in the low-density environments where stars form, given the millions-of-year timescales it takes to gather gas and turn it into stars, magnetic effects can plausibly add up to something substantial over time.


Goodman, O’Neill, and their colleagues look forward to finding out.

“I’ve had a great experience doing this research at CfA and assembling something new and exciting with this 3D magnetic map,” says O’Neill. “I hope this map is a starting point for expanding our understanding of the superbubbles throughout our galaxy.”

Support for this work was provided by the National Science Foundation, NASA, and the Gordon and Betty Moore Foundation.

About the 3D Milky Way Project


This research is part of an ongoing collaboration amongst several open-source software projects working together to create a 3D map of the Milky Way galaxy. The software packages, including glue, OpenSpace, and AAS WorldWide Telescope, are interconnected via API-like interfaces, and they access a wide variety of open data sets, including those from Planck and Gaia. Learn more about the 3D Milky Way project, which includes a collaboration with staff at the Hayden Planetarium at the American Museum of Natural History, where some results will be showcased, at MilkyWay3D.org. The 3D interactive figures in the Authorea preprint sharing this work are made possible via additional free software, including plot.ly and PyVista.

About the Center for Astrophysics | Harvard & Smithsonian

The Center for Astrophysics | Harvard & Smithsonian is a collaboration between Harvard and the Smithsonian designed to ask—and ultimately answer—humanity’s greatest unresolved questions about the nature of the universe. The Center for Astrophysics is headquartered in Cambridge, MA, with research facilities across the U.S. and around the world.

728x90x4

Source link

Continue Reading

News

Here’s how Helene and other storms dumped a whopping 40 trillion gallons of rain on the South

Published

 on


More than 40 trillion gallons of rain drenched the Southeast United States in the last week from Hurricane Helene and a run-of-the-mill rainstorm that sloshed in ahead of it — an unheard of amount of water that has stunned experts.

That’s enough to fill the Dallas Cowboys’ stadium 51,000 times, or Lake Tahoe just once. If it was concentrated just on the state of North Carolina that much water would be 3.5 feet deep (more than 1 meter). It’s enough to fill more than 60 million Olympic-size swimming pools.

“That’s an astronomical amount of precipitation,” said Ed Clark, head of the National Oceanic and Atmospheric Administration’s National Water Center in Tuscaloosa, Alabama. “I have not seen something in my 25 years of working at the weather service that is this geographically large of an extent and the sheer volume of water that fell from the sky.”

The flood damage from the rain is apocalyptic, meteorologists said. More than 100 people are dead, according to officials.

Private meteorologist Ryan Maue, a former NOAA chief scientist, calculated the amount of rain, using precipitation measurements made in 2.5-mile-by-2.5 mile grids as measured by satellites and ground observations. He came up with 40 trillion gallons through Sunday for the eastern United States, with 20 trillion gallons of that hitting just Georgia, Tennessee, the Carolinas and Florida from Hurricane Helene.

Clark did the calculations independently and said the 40 trillion gallon figure (151 trillion liters) is about right and, if anything, conservative. Maue said maybe 1 to 2 trillion more gallons of rain had fallen, much if it in Virginia, since his calculations.

Clark, who spends much of his work on issues of shrinking western water supplies, said to put the amount of rain in perspective, it’s more than twice the combined amount of water stored by two key Colorado River basin reservoirs: Lake Powell and Lake Mead.

Several meteorologists said this was a combination of two, maybe three storm systems. Before Helene struck, rain had fallen heavily for days because a low pressure system had “cut off” from the jet stream — which moves weather systems along west to east — and stalled over the Southeast. That funneled plenty of warm water from the Gulf of Mexico. And a storm that fell just short of named status parked along North Carolina’s Atlantic coast, dumping as much as 20 inches of rain, said North Carolina state climatologist Kathie Dello.

Then add Helene, one of the largest storms in the last couple decades and one that held plenty of rain because it was young and moved fast before it hit the Appalachians, said University of Albany hurricane expert Kristen Corbosiero.

“It was not just a perfect storm, but it was a combination of multiple storms that that led to the enormous amount of rain,” Maue said. “That collected at high elevation, we’re talking 3,000 to 6000 feet. And when you drop trillions of gallons on a mountain, that has to go down.”

The fact that these storms hit the mountains made everything worse, and not just because of runoff. The interaction between the mountains and the storm systems wrings more moisture out of the air, Clark, Maue and Corbosiero said.

North Carolina weather officials said their top measurement total was 31.33 inches in the tiny town of Busick. Mount Mitchell also got more than 2 feet of rainfall.

Before 2017’s Hurricane Harvey, “I said to our colleagues, you know, I never thought in my career that we would measure rainfall in feet,” Clark said. “And after Harvey, Florence, the more isolated events in eastern Kentucky, portions of South Dakota. We’re seeing events year in and year out where we are measuring rainfall in feet.”

Storms are getting wetter as the climate change s, said Corbosiero and Dello. A basic law of physics says the air holds nearly 4% more moisture for every degree Fahrenheit warmer (7% for every degree Celsius) and the world has warmed more than 2 degrees (1.2 degrees Celsius) since pre-industrial times.

Corbosiero said meteorologists are vigorously debating how much of Helene is due to worsening climate change and how much is random.

For Dello, the “fingerprints of climate change” were clear.

“We’ve seen tropical storm impacts in western North Carolina. But these storms are wetter and these storms are warmer. And there would have been a time when a tropical storm would have been heading toward North Carolina and would have caused some rain and some damage, but not apocalyptic destruction. ”

___

Follow AP’s climate coverage at https://apnews.com/hub/climate

___

Follow Seth Borenstein on Twitter at @borenbears

___

Associated Press climate and environmental coverage receives support from several private foundations. See more about AP’s climate initiative here. The AP is solely responsible for all content.

Source link

Continue Reading

Science

‘Big Sam’: Paleontologists unearth giant skull of Pachyrhinosaurus in Alberta

Published

 on


It’s a dinosaur that roamed Alberta’s badlands more than 70 million years ago, sporting a big, bumpy, bony head the size of a baby elephant.

On Wednesday, paleontologists near Grande Prairie pulled its 272-kilogram skull from the ground.

They call it “Big Sam.”

The adult Pachyrhinosaurus is the second plant-eating dinosaur to be unearthed from a dense bonebed belonging to a herd that died together on the edge of a valley that now sits 450 kilometres northwest of Edmonton.

It didn’t die alone.

“We have hundreds of juvenile bones in the bonebed, so we know that there are many babies and some adults among all of the big adults,” Emily Bamforth, a paleontologist with the nearby Philip J. Currie Dinosaur Museum, said in an interview on the way to the dig site.

She described the horned Pachyrhinosaurus as “the smaller, older cousin of the triceratops.”

“This species of dinosaur is endemic to the Grand Prairie area, so it’s found here and nowhere else in the world. They are … kind of about the size of an Indian elephant and a rhino,” she added.

The head alone, she said, is about the size of a baby elephant.

The discovery was a long time coming.

The bonebed was first discovered by a high school teacher out for a walk about 50 years ago. It took the teacher a decade to get anyone from southern Alberta to come to take a look.

“At the time, sort of in the ’70s and ’80s, paleontology in northern Alberta was virtually unknown,” said Bamforth.

When paleontogists eventually got to the site, Bamforth said, they learned “it’s actually one of the densest dinosaur bonebeds in North America.”

“It contains about 100 to 300 bones per square metre,” she said.

Paleontologists have been at the site sporadically ever since, combing through bones belonging to turtles, dinosaurs and lizards. Sixteen years ago, they discovered a large skull of an approximately 30-year-old Pachyrhinosaurus, which is now at the museum.

About a year ago, they found the second adult: Big Sam.

Bamforth said both dinosaurs are believed to have been the elders in the herd.

“Their distinguishing feature is that, instead of having a horn on their nose like a triceratops, they had this big, bony bump called a boss. And they have big, bony bumps over their eyes as well,” she said.

“It makes them look a little strange. It’s the one dinosaur that if you find it, it’s the only possible thing it can be.”

The genders of the two adults are unknown.

Bamforth said the extraction was difficult because Big Sam was intertwined in a cluster of about 300 other bones.

The skull was found upside down, “as if the animal was lying on its back,” but was well preserved, she said.

She said the excavation process involved putting plaster on the skull and wooden planks around if for stability. From there, it was lifted out — very carefully — with a crane, and was to be shipped on a trolley to the museum for study.

“I have extracted skulls in the past. This is probably the biggest one I’ve ever done though,” said Bamforth.

“It’s pretty exciting.”

This report by The Canadian Press was first published Sept. 25, 2024.

The Canadian Press. All rights reserved.

Source link

Continue Reading

News

The ancient jar smashed by a 4-year-old is back on display at an Israeli museum after repair

Published

 on


TEL AVIV, Israel (AP) — A rare Bronze-Era jar accidentally smashed by a 4-year-old visiting a museum was back on display Wednesday after restoration experts were able to carefully piece the artifact back together.

Last month, a family from northern Israel was visiting the museum when their youngest son tipped over the jar, which smashed into pieces.

Alex Geller, the boy’s father, said his son — the youngest of three — is exceptionally curious, and that the moment he heard the crash, “please let that not be my child” was the first thought that raced through his head.

The jar has been on display at the Hecht Museum in Haifa for 35 years. It was one of the only containers of its size and from that period still complete when it was discovered.

The Bronze Age jar is one of many artifacts exhibited out in the open, part of the Hecht Museum’s vision of letting visitors explore history without glass barriers, said Inbal Rivlin, the director of the museum, which is associated with Haifa University in northern Israel.

It was likely used to hold wine or oil, and dates back to between 2200 and 1500 B.C.

Rivlin and the museum decided to turn the moment, which captured international attention, into a teaching moment, inviting the Geller family back for a special visit and hands-on activity to illustrate the restoration process.

Rivlin added that the incident provided a welcome distraction from the ongoing war in Gaza. “Well, he’s just a kid. So I think that somehow it touches the heart of the people in Israel and around the world,“ said Rivlin.

Roee Shafir, a restoration expert at the museum, said the repairs would be fairly simple, as the pieces were from a single, complete jar. Archaeologists often face the more daunting task of sifting through piles of shards from multiple objects and trying to piece them together.

Experts used 3D technology, hi-resolution videos, and special glue to painstakingly reconstruct the large jar.

Less than two weeks after it broke, the jar went back on display at the museum. The gluing process left small hairline cracks, and a few pieces are missing, but the jar’s impressive size remains.

The only noticeable difference in the exhibit was a new sign reading “please don’t touch.”

The Canadian Press. All rights reserved.

Source link

Continue Reading

Trending