adplus-dvertising
Connect with us

Science

René Doyon, Radio-Canada’s Scientist of the Year… again!

Published

 on

We are proud to announce today that Radio-Canada is awarding its 2022 Scientifique de l’année Award to our Director, astrophysicist René Doyon, for his contribution as Principal Investigator for the Canadian instruments on the James Webb Space Telescope.

Dr. Doyon, who also won the Scientifique de l’année Award in 2008 with his colleagues Christian Marois and David Lafrenière for taking the first-ever image of an exoplanetary system, wins it for a second time this year: a first for a winner!

Dr. Doyon’s main areas of expertise are the study of exoplanets and the development of astronomical observation instruments. As Principal Investigator of the Canadian participation in the James Webb Space Telescope project, he enabled a large Canadian team to provide one of the four scientific instruments of the telescope, an observing instrument, as well as a guidance device essential to its proper operation. Designed in particular to study the atmosphere of exoplanets and determine their chemical composition, the James Webb Space Telescope is already helping to push back the boundaries of our knowledge. After more than 20 years of development and construction, it delivered its first images of the Universe last July, revealing the splendor and immensity of the cosmos with unequaled precision.

300x250x1

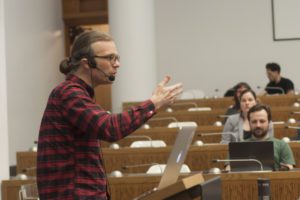
Loïc Albert, NIRISS Instrument Scientist who has worked with M. Doyon for 25 years. Credit: É. Artigau.

René Doyon has built a strong team that includes many key members, many of whom played crucial roles in the James Webb Telescope adventure. One of them is researcher Loïc Albert, who works in particular on the JWST’s NIRISS scientific instrument. He provides a testimony on his work with Mr. Doyon, which started in 1999: “René is really passionate about science. His enthusiasm crosses time and the different projects he leads. It is in the most critical moments that he comes up with unexpected solutions that only he can come up with. Although he stands out for his leadership and his energy to lead projects to observe the sky, René remains with both feet on the ground. For he is a warm, friendly human being who listens to the people around him. Bravo René!”

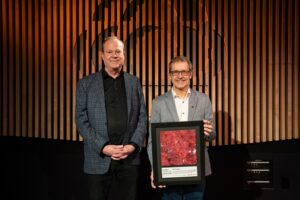
René Doyon (right) with Radio-Canada’s senior vice president, Michel Bissonnette, Credit: Martin Ouellet-Diotte.

Radio-Canada’s senior vice-president, Michel Bissonnette, underlines René Doyon’s exceptional contribution to science in these terms: “Mr. René Doyon is one of those researchers who has the ability to give us hope, to make us dream. Through his quest, he tries to answer fundamental questions such as the one everyone is asking: are we alone in the Universe? No one has the answer, but the unprecedented power of the telescope to which he contributed could reveal many secrets.”

On January 29 at noon, Dr. Doyon will be interviewed by host Sophie-Andrée Blondin in a one-hour interview recorded live in front of a live audience on ICI PREMIÈRE’s program Les années lumière. At 6:30 p.m., on the program Découverte, on ICI TÉLÉ, host Charles Tisseyre will present a report by Gaëlle Lussiaà-Berdou and François Perré that will allow us to better understand Mr. Doyon’s exceptional contribution to science.

About the award

The Radio-Canada Scientifique de l’année Award was first presented in 1987 and is now in its 36th year. It is awarded annually to a person or team who, during the past year, has distinguished themselves by a discovery, a publication or an achievement worthy of recognition.

728x90x4

Source link

Continue Reading

Science

Astronomers analyze first results from ESO telescopes on the aftermath of DART's asteroid impact – Phys.org

Published

 on


This series of images, taken with the MUSE instrument on ESO’s Very Large Telescope, shows the evolution of the cloud of debris that was ejected when NASA’s DART spacecraft collided with the asteroid Dimorphos. The first image was taken on 26 September 2022, just before the impact, and the last one was taken almost one month later on 25 October. Over this period several structures developed: clumps, spirals, and a long tail of dust pushed away by the Sun’s radiation. The white arrow in each panel marks the direction of the Sun. Dimorphos orbits a larger asteroid called Didymos. The white horizontal bar corresponds to 500 kilometers, but the asteroids are only 1 kilometer apart, so they can’t be discerned in these images. The background streaks seen here are due to the apparent movement of the background stars during the observations while the telescope was tracking the asteroid pair. Credit: ESO/Opitom et al.

Using ESO’s Very Large Telescope (VLT), two teams of astronomers have observed the aftermath of the collision between NASA’s Double Asteroid Redirection Test (DART) spacecraft and the asteroid Dimorphos. The controlled impact was a test of planetary defense, but also gave astronomers a unique opportunity to learn more about the asteroid’s composition from the expelled material.

On September 26, 2022, the DART spacecraft collided with the asteroid Dimorphos in a controlled test of our asteroid deflection capabilities. The impact took place 11 million kilometers away from Earth, close enough to be observed in detail with many telescopes. All four 8.2-meter telescopes of ESO’s VLT in Chile observed the aftermath of the impact, and the first results of these VLT observations have now been published in two papers.

300x250x1

“Asteroids are some of the most basic relics of what all the planets and moons in our were created from,” says Brian Murphy, a Ph.D. student at the University of Edinburgh in the UK and co-author of one of the studies. “Studying the cloud of material ejected after DART’s impact can therefore tell us about how our solar system formed.”

“Impacts between asteroids happen naturally, but you never know it in advance,” continues Cyrielle Opitom, an astronomer also at the University of Edinburgh and lead author of one of the articles. “DART is a really great opportunity to study a controlled impact, almost as in a laboratory.”

Opitom and her team followed the evolution of the cloud of debris for a month with the Multi Unit Spectroscopic Explorer (MUSE) instrument at ESO’s VLT. They found that the ejected cloud was bluer than the asteroid itself was before the impact, indicating that the cloud could be made of very fine particles. In the hours and days that followed the impact other structures developed: clumps, spirals and a pushed away by the sun’s radiation. The spirals and tail were redder than the initial cloud, and so could be made of larger particles.

MUSE allowed Opitom’s team to break up the light from the cloud into a rainbow-like pattern and look for the chemical fingerprints of different gases. In particular, they searched for oxygen and water coming from ice exposed by the impact. But they found nothing.

“Asteroids are not expected to contain significant amounts of ice, so detecting any trace of water would have been a real surprise,” explains Opitom. They also looked for traces of the propellant of the DART spacecraft, but found none. “We knew it was a long shot,” she says, “as the amount of gas that would be left in the tanks from the propulsion system would not be huge. Furthermore, some of it would have traveled too far to detect it with MUSE by the time we started observing.”

Another team, led by Stefano Bagnulo, an astronomer at the Armagh Observatory and Planetarium in the UK, studied how the DART impact altered the surface of the asteroid.

“When we observe the objects in our solar system, we are looking at the sunlight that is scattered by their surface or by their atmosphere, which becomes partially polarized,” explains Bagnulo. This means that oscillate along a preferred direction rather than randomly. “Tracking how the polarization changes with the orientation of the asteroid relative to us and the sun reveals the structure and composition of its surface.”

Bagnulo and his colleagues used the FOcal Reducer/low dispersion Spectrograph 2 (FORS2) instrument at the VLT to monitor the asteroid, and found that the level of polarization suddenly dropped after the impact. At the same time, the overall brightness of the system increased. One possible explanation is that the impact exposed more pristine material from the interior of the asteroid.

“Maybe the material excavated by the impact was intrinsically brighter and less polarizing than the material on the surface, because it was never exposed to solar wind and solar radiation,” says Bagnulo.

Another possibility is that the impact destroyed particles on the surface, thus ejecting much smaller ones into the cloud of debris. “We know that under certain circumstances, smaller fragments are more efficient at reflecting light and less efficient at polarizing it,” explains Zuri Gray, a Ph.D. student also at the Armagh Observatory and Planetarium.

The studies by the teams led by Bagnulo and Opitom show the potential of the VLT when its different instruments work together. In fact, in addition to MUSE and FORS2, the aftermath of the impact was observed with two other VLT instruments, and analysis of these data is ongoing.

“This research took advantage of a unique opportunity when NASA impacted an asteroid,” concludes Opitom, “so it cannot be repeated by any future facility. This makes the data obtained with the VLT around the time of impact extremely precious when it comes to better understanding the nature of asteroids.”

The research highlighted in the first part of this article was presented in the paper “Morphology and spectral properties of the DART impact ejecta with VLT/MUSE,” which appears in Astronomy & Astrophysics. The second part of this article refers to the paper “Optical spectropolarimetry of binary Didymos-Dimorphos before and after the DART ” in Astrophysical Journal Letters.

More information:
C. Opitom et al, Morphology and spectral properties of the DART impact ejecta with VLT/MUSE, Astronomy & Astrophysics (2023). DOI: 10.1051/0004-6361/202345960

Optical spectropolarimetry of binary asteroid Didymos-Dimorphos before and after the DART impact, Astrophysical Journal Letters (2023). DOI: 0.3847/2041-8213/acb261. iopscience.iop.org/article/10. … 847/2041-8213/acb261

Provided by
ESO

Citation:
Astronomers analyze first results from ESO telescopes on the aftermath of DART’s asteroid impact (2023, March 21)
retrieved 21 March 2023
from https://phys.org/news/2023-03-astronomers-results-eso-telescopes-aftermath.html

This document is subject to copyright. Apart from any fair dealing for the purpose of private study or research, no
part may be reproduced without the written permission. The content is provided for information purposes only.

Adblock test (Why?)

728x90x4

Source link

Continue Reading

Science

Potential to locate life on Mars with Artificial Intelligence – Innovation News Network

Published

 on


An international team of researchers has found that Artificial Intelligence (AI) can help identify hidden patterns within geographical data that could indicate life on Mars.  

As there are only a few opportunities to collect samples from Mars in the search for life beyond Earth, it is crucial that these missions target locations that have the best chance of harbouring extra-terrestrial life. The new study, led by an international team of over 50 researchers, ensures that this can be supported by using Artificial Intelligence and Machine Learning methods. This technology can be used to identify hidden patterns within geographical data that could indicate the presence of life on Mars. 

The work, ‘Orbit-to-Ground Framework to Decode and Predict Biosignature Patterns in Terrestrial Analogues,’ has been published in Nature Astronomy.  

The resulting model was capable of locating biosignatures that have the potential to indicate life on Mars 

The first part of the study, led by Dr Kimberley Warren-Rhodes at the SETI Institute, was an ecological survey of a 3 km² area in the Salar de Pajonales basin, at the boundary of the Chilean Atacama Desert and Altiplano in South America. This was used to map the distribution of photosynthetic microorganisms. Gene sequencing and infrared spectroscopy were also used to reveal distinct markers of life, called ‘biosignatures.’ Aerial images were then combined with this data to train a Machine Learning model to predict which macro- and microhabitat types would be associated with biosignatures that could indicate life on Mars and other areas. 

300x250x1

The resulting model could locate and detect biosignatures up to 87.5% of the time on data on which it was not trained. This decreased the search area required to find a positive result by up to 97%. In the future, life on Mars could be detected through the identification of the areas most likely to contain signs of life. These can then be extensively searched by rovers. 

© shutterstock

Dr Freddie Kalaitzis from the University of Oxford’s Department of Computer Science led the application of Machine Learning methods to microhabitat data. He said: “This work demonstrates an AI-guided protocol for searching for life on a Mars-like terrestrial analogue on Earth. This protocol is the first of its kind trained on actual field data, and its application can, in principle, generalise to other extreme life-harbouring environments. Our next steps will be to test this method further on Earth with the aim that it will eventually aid our exploration for biosignatures elsewhere in the solar system, such as Mars, Titan, and Europa.” 

On Earth, one of the most similar analogues to Mars is the Pajonales, a four-million-year-old lakebed. This area is considered to be inhospitable to most forms of life. Comparable to the evaporitic basins of Mars, the high altitude (3,541 m) basin experiences exceptionally strong levels of ultraviolet radiation, hypersalinity, and low temperatures. 

Water availability is likely to be the key factor determining the position of biological hotspots 

The researchers collected over 7,700 images and 1,150 samples and tested for the presence of photosynthetic microbes living within the salt domes, rocks, and alabaster crystals that make up the basin’s surface. Here, biosignature markers, such as carotenoid and chlorophyll pigments, could be seen as orange-pink and green layers respectively. 

Ground sampling data and 3D topographical mapping were combined with the drone images to classify regions into four macrohabitats (metre to kilometre scales) and six microhabitats (centimetre scale). The team found that the microbial organisms across the study site were clustered in distinct regions, despite the Pajonales having a near-uniform mineral composition.  

Follow-up experiments showed that rather than environmental variables, like nutrient or light availability, determining the position of, biological hotspots water availability is the most likely factor.  

[embedded content]

The combined dataset was used to train convolutional neural networks to predict which macro- and microhabitats were most strongly associated with biosignatures.  

“For both the aerial images and ground-based centimetre-scale data, the model demonstrated high predictive capability for the presence of geological materials strongly likely to contain biosignatures,” said Dr Kalaitzis.  

“The results aligned well with ground-truth data, with the distribution of biosignatures being strongly associated with hydrological features.” 

The model will be used to map other harsh ecosystems  

Now, the researchers aim to test the model’s ability to predict the location of similar yet different natural systems in the Pajonales basin, such as ancient stromatolite fossils. The model will also be used to map other harsh ecosystems, including hot springs and permafrost soils. The data from these studies will inform and test hypotheses on the mechanisms that living organisms use to survive in extreme environments. 

“Our study has once again demonstrated the power of Machine Learning methods to accelerate scientific discovery through its ability to analyse immense volumes of different data and identify patterns that would be indiscernible to a human being,” Dr Kalaitzis added.  

“Ultimately, we hope the approach will facilitate the compilation of a databank of biosignature probability and habitability algorithms, roadmaps, and models that can serve as a guide for exploration of life on Mars.” 

Subscribe to our newsletter

Adblock test (Why?)

728x90x4

Source link

Continue Reading

Science

By cracking a metal 3D-printing conundrum, researchers propel the technology toward widespread application – EurekAlert

Published

 on


image: Researchers used high-speed X-ray diffraction to identify the crystal structures that form within steel as it is 3D-printed. The angle at which the X-rays exit the metal correspond to types of crystal structures within.
view more 

Credit: H. König et al. via Creative Commons (https://creativecommons.org/licenses/by/4.0/), adapted by N. Hanacek/NIST

Researchers have not yet gotten the additive manufacturing, or 3D printing, of metals down to a science completely. Gaps in our understanding of what happens within metal during the process have made results inconsistent. But a new breakthrough could grant an unprecedented level of mastery over metal 3D printing. 

Using two different particle accelerator facilities, researchers at the National Institute of Standards and Technology (NIST), KTH Royal Institute of Technology in Sweden and other institutions have peered into the internal structure of steel as it was melted and then solidified during 3D printing. The findings, published in Acta Materialia, unlock a computational tool for 3D-printing professionals, offering them a greater ability to predict and control the characteristics of printed parts, potentially improving the technology’s consistency and feasibility for large-scale manufacturing.   

A common approach for printing metal pieces involves essentially welding pools of powdered metal with lasers, layer by layer, into a desired shape. During the first steps of printing with a metal alloy, wherein the material rapidly heats up and cools off, its atoms — which can be a smattering of different elements — pack into ordered, crystalline formations. The crystals determine the properties, such as toughness and corrosion resistance, of the printed part. Different crystal structures can emerge, each with their own pros and cons. 

300x250x1

“Basically, if we can control the microstructure during the initial steps of the printing process, then we can obtain the desired crystals and, ultimately, determine the performance of additively manufactured parts,” said NIST physicist Fan Zhang, a study co-author. 

While the printing process wastes less material and can be used to produce more complicated shapes than traditional manufacturing methods, researchers have struggled to grasp how to steer metal toward particular kinds of crystals over others.  

This lack of knowledge has led to less than desirable results, such as parts with complex shapes cracking prematurely thanks to their crystal structure.  

“Among the thousands of alloys that are commonly manufactured, only a handful can be made using additive manufacturing,” Zhang said. 

Part of the challenge for scientists has been that solidification during metal 3D printing occurs in the blink of an eye.  

To capture the high-speed phenomenon, the authors of the new study employed powerful X-rays generated by cyclic particle accelerators, called synchrotrons, at Argonne National Laboratory’s Advanced Photon Source and the Paul Scherrer Institute’s Swiss Light Source.  

The team sought to learn how the cooling rates of metal, which can be controlled by laser power and movement settings, influence crystal structure. Then the researchers would compare the data to the predictions of a widely used computational model developed in the ’80s that describes the solidification of alloys.  

While the model is trusted for traditional manufacturing processes, the jury has been out on its applicability in the unique context of 3D printing’s rapid temperature shifts.  

“Synchrotron experiments are time consuming and expensive, so you cannot run them for every condition that you’re interested in. But they are very useful for validating models that you then can use to simulate the interesting conditions,” said study co-author Greta Lindwall, an associate professor of materials science and engineering at KTH Royal Institute of Technology. 

Within the synchrotrons, the authors set up additive manufacturing conditions for hot-work tool steel — a kind of metal used to make, as the name suggests, tools that can withstand high temperatures.  

As lasers liquified the metal and different crystals emerged, X-ray beams probed the samples with enough energy and speed to produce images of the fleeting process. The team members required two separate facilities to support the cooling rates they wanted to test, which ranged from temperatures of tens of thousands to more than a million kelvins per second.  

The data the researchers collected depicted the push and pull between two kinds of crystal structures, austenite and delta ferrite, the latter being associated with cracking in printed parts. As cooling rates surpassed 1.5 million kelvins (2.7 million degrees Fahrenheit) per second, austenite began to dominate its rival. This critical threshold lined up with what the model foretold.  

“The model and the experimental data are nicely in agreement. When we saw the results, we were really excited,” Zhang said.  

The model has long been a reliable tool for materials design in traditional manufacturing, and now the 3D-printing space may be afforded the same support.  

The results indicate that the model can inform scientists and engineers on what cooling rates to select for the early solidification steps of the printing process. That way the optimal crystal structure would appear within their desired material, making metal 3D printing less of a roll of the dice.  

“If we have data, we can use it to validate the models. That’s how you accelerate the widespread adoption of additive manufacturing for industrial use,” Zhang said.


Disclaimer: AAAS and EurekAlert! are not responsible for the accuracy of news releases posted to EurekAlert! by contributing institutions or for the use of any information through the EurekAlert system.

Adblock test (Why?)

728x90x4

Source link

Continue Reading

Trending