


wildpixel/iStock via Getty Images
Financial Stress Index
Has this market got you stressed out? Worried about mortgages, debt, or the stock market and whether you can retire on time?
Unfortunately I don’t have a fix for that, but there’s a pretty close second, and it comes in the form of a composite index that can help you understand the daily state of the stock market and quantify what “financial stress” actually means for the global financial system.
The OFR Financial Stress Index is provided by the Office of Financial Research and it is constructed using 33 financial market variables. When the FSI index is positive it means that stress levels are above average and worth taking note of, and when it is negative stress levels are less worrisome. We go into further detail on that below.
What’s worth noting is that these are pretty heavy weight measures, many of which are used by the Fed and investment banks to gauge risk. For those with experience in financial markets the FSI includes:
- Credit – Credit spreads, both HR and IG Corporate
- Equity valuation – Stock valuations, the stock index price levels
- Funding – Bank lending standards, credit conditions index
- Safe Assets – Valuations for assets like Yen, CHF, Gold that are considered safe stores
- Volatility – VIX Index, Move Index, implied and realised volatility
What we are going to do in this article is take this existing index and back-test it against the S&P 500 index to turn it into a very valuable and actionable resource.
Overview of the Financial Stress Index and S&P 500
Let’s look at the whole dataset from the top:
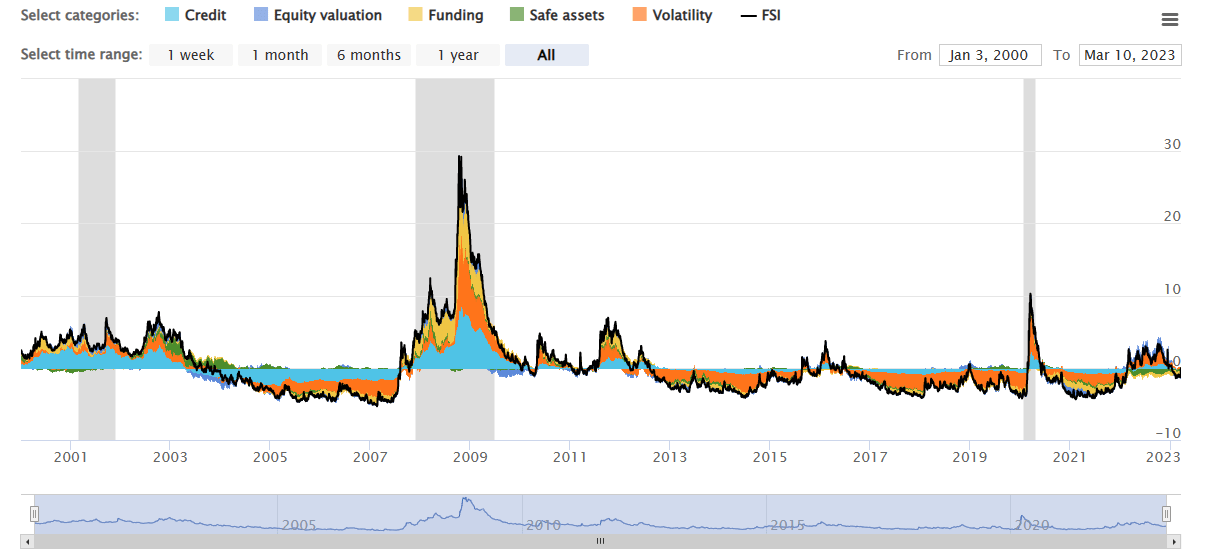
OFR Financial Stress Index site
The FSI has done a good job of covering the recessions over the past 22 years and being aligned to forecasting them with a degree of accuracy.
Furthermore if we look closely, unlike quite a few indicators, it actually correctly responds to the drawn out nature of the Dot Com bust and remains elevated from 2000 until early 2003.
Overall the index appears to have a good correlation with the stock market. But how good? We can do a deep dive into two major crises and then backtest the model against the S&P 500.
Analysis of Dot Com Bust (2000-2003)
The Dot Com bust began in late 2000 at the height of the internet boom. Many of us know the story so we won’t feel the need to go into too much detail about what started the bust and the factors leading up to it.
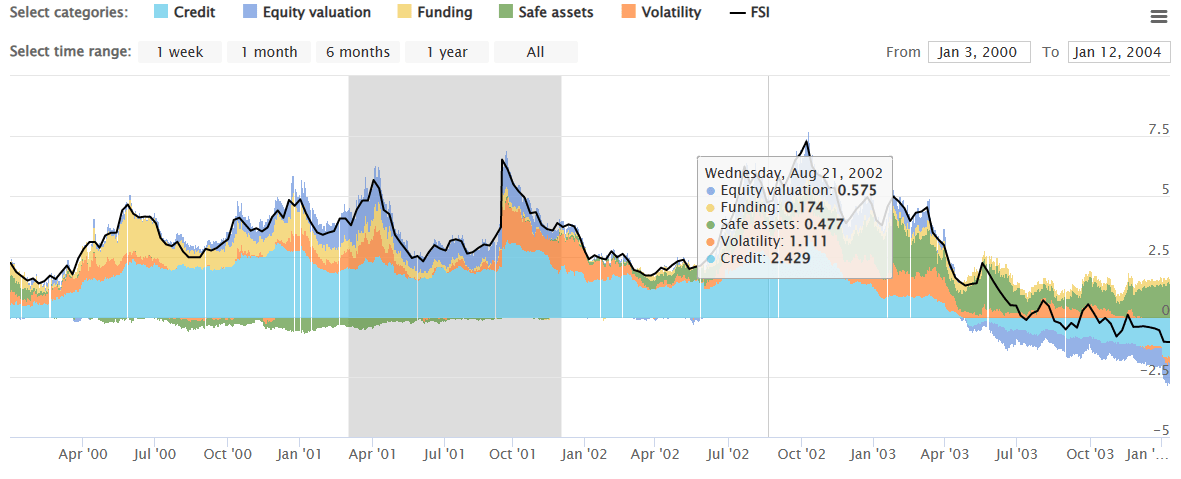
OFR Financial Stress Index site
The FSI registered 2.236 in February of 2000 and this represented elevated credit spreads, volatility rising and minor funding issues in the financial system. The model remained elevated straight through to the formal onset of recession in 2001, where it peaked at 5.68 in April 2001 and then troughed but remained above 2.5 into 2002. The model was elevated throughout 2002 and peaked even higher at 7.28 in October of 2002. By the end of the Dot Com bust it hit a negative value in July of 2003.
If you had sold in January 2000 – when FSI was above 0, and bought again at the beginning of July 2003 – when FSI was below 0, you would have avoided the -31.75% drawdown. This isn’t the full drawdown but represents a decent proportion of it.
Analysis of Global Financial Crisis (2008-2009)
It’s a similar picture for the Global Financial Crisis that started in 2007 but really picked up steam in 2008.
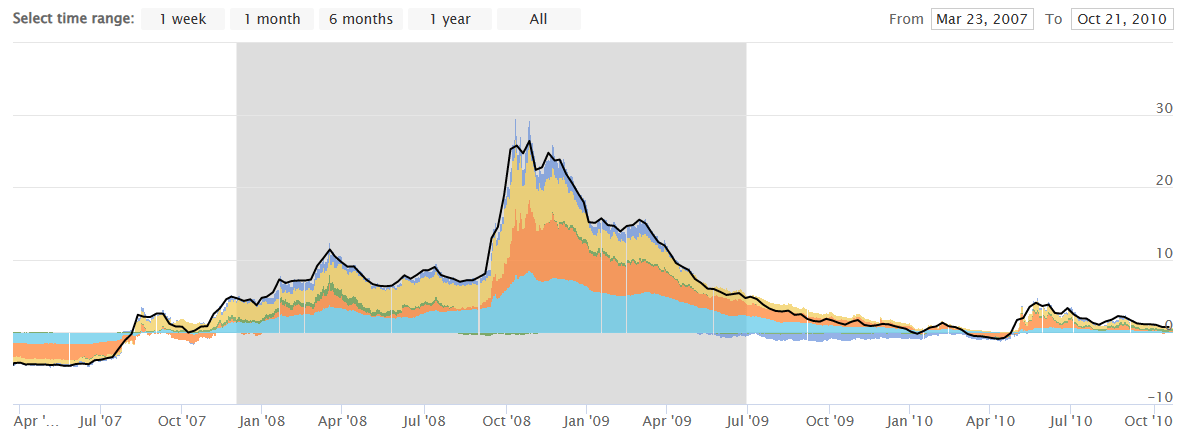
OFR Financial Stress Index site
The FSI Index went above 0 in August of 2007 and remained slightly above that level into 2008, where it steadily rose towards a first peak in April 2008 at 11.39. The index remained at this elevated level until it really took off, when the financial system was melting down over the winter of 2008 between October and December – hitting an ear splitting all time high of 26.42 in October.
The model returned to zero by January 2010. If you had sold in August 2007 and then bought back in when it hit zero in January 2010, you would have avoided -23.24% of the drawdown.
There were repeat occurences linked to the financial crisis that appeared in April to December of 2010, and again in 2011 during the Occupy Wallstreet protests and the European Debt Crisis. However rather than cover those in detail we’ll refer you to the following chart:
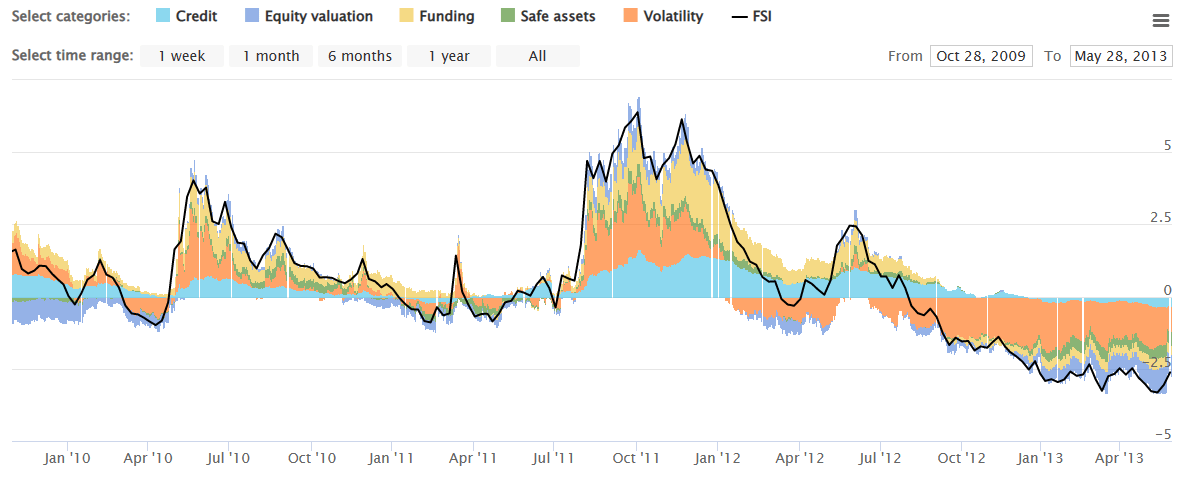
OFR Financial Stress Index site
This shows, again, the model capturing the moves fairly well at the 0 point.
Overall Model Accuracy – Adjusting the Model
Clearly if you can avoid a major drawdown in two bear markets then the model must have some utility, right? That of course depends on whether the other time periods when it gives false signals (the model shows financial stress but instead of stocks going down, they go up) compensate for the value that you save during genuine financial crises.
It’s very important when we backtest a system that we don’t cherry pick data or assess it simply off of the outputs from a graph. Instead we must set fair parameters and account for trading costs, transactional lag (by one day) and periods when the model underperforms.
In order to fairly assess the model we looked at blanket rules across the whole data set and then we used Python to backtest the performance of the model under those conditions.
Basic System – Rules & Conditions
The first test was for the basic system articulated above.
- If the FSI is below 0, the system is a buy and you own the S&P 500 index (SPY)
- If the FSI is above 0, the system is a sell and you own cash through SPDR Bloomberg 1-3 Month T-Bill index (BIL)
The results of the first test are:
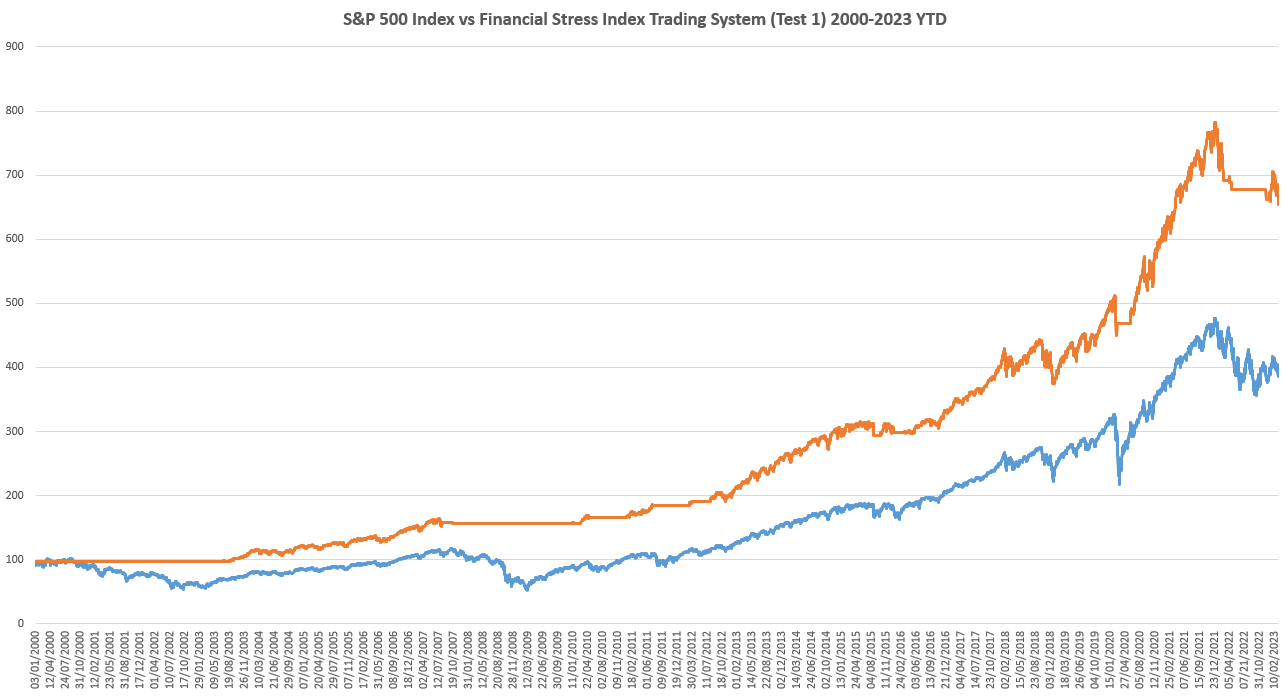
David Huston
The vanilla system trading out of the box produces a respectable return of 671% between the year 2000 and March 2023 YTD. That’s compared to a price return on the S&P 500 index of 396%.
To demonstrate that there is no financial chicannery going on here we also separately looked at the S&P 500 total return including dividends, and having a more aggressive fixed income option. Our backtesting shows that if you use the S&P 500 total return index and also have your money invested in TLT or LQD, you get a similar level of ourperformance.
But we can do better!
Recursively Optimised System – Rules & Conditions
The second test was for an improved level of the FCI index. If you notice, it triggers slightly early during both crises. What if we tested all of the possible trigger levels and set upon the most optimal?
To do so we use a recursive Python model that loops through the data and back-tests it continuously until we find an optimal figure. Rather than show all of the results we’ll laser in on what came as an output from this recursive analysis.
- If the FSI is below X, the system is a buy and you own the S&P 500 index
- If the FSI is above X, the system is a sell and you own cash through SPDR Bloomberg 1-3 Month T-Bill index
There is a significant improvement in the model after it has tested various options, including:
| Test 5 | FSI = 0.5 | S&P 500 = 795% |
| Test 17 | FSI = 8 | S&P 500 = 656% |
| Test 25 | FSI = -0.45 | S&P 500 = 626% |
| Test 131 | FSI = 1.3 | S&P 500 = 873% |
| Test 204 | FSI = 1.5 | S&P 500 = 982% |
The optimal level for the FSI is actually 1.5 and this leads to a really remarkable outperformance:
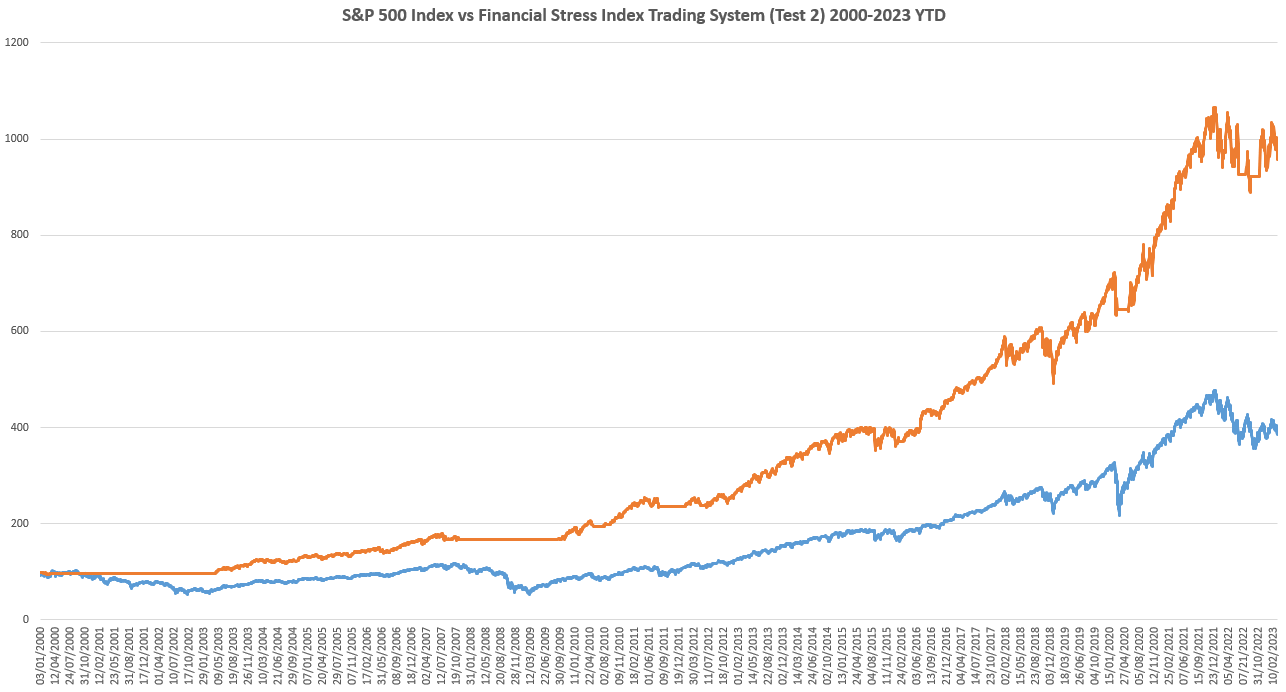
David Huston
The system now has a more granular view of risk, which is calibrated to when the level of financial stress in the system is enough to warrant moving your money out of the market and into cash or cash equivalents.
Further testing ideas include weighting the underlying constituents and entering the market in earlier than the current model. For example during Covid once the VIX hit an astonishing close of 65 in March of 2020, when the volatility index subsided one could have taken an earlier long position.
The key though is not to make this model too complicated and to instead rely on something that has a fair and consistent backtest without over-fitting the data.
Limitations & Further Research
To cover off a potential rebuttal to this analysis. You may be thinking: “This only goes back to 2000 and there were two major financial crises during that period. You’re cherry picking the data.”
In a future article I will extend this analysis to cover a precursor to the FSI index, which was called the NFSI index. There are several indexes that date back to 1993 (NFSI) and the 1970s (ANFCI) and they also provide valuable data for timing the market based on financial conditions. However, given their differences, I have decided to treat them separately and in the next part of the series so that our readers can build on their knowledge and understand the more basic system first.
One reason we believe that a trading system based around the Financial Stress Index is not commonplace is that macroeconomic timing has fallen out of favour. Have you ever heard of Martin Zweig? He was an influential investment adviser known for his data-driven studies and macroeconomic timing models who once owned the most expensive penthouse on Fifth Avenue. During the boom years of the 1990s and 2000s his models underperformed the market. As with any approach to generating alpha the efficacy waxes and wanes.
Results
Using the Financial Stress Index as a guide for deciding when to be long the markets appears to be a reasonable trading strategy predicated on the fact that, with increased financial stress in the system, there is also increased probability of a sell-off. We have used this system last year as a proxy for risk, which allowed us to adjust our asset allocation accordingly.
For the vanilla model that sells risk assets when the Financial Stress Index (FSI) goes above zero, and buys when it is below 0, the model returns 671% between 2000 and 2023 YTD against a return of 396% for the S&P 500.
With recursive optimisation using Python we found that the model produced an impressive 982% against 396% for the index, which represents a nearly 2.5 fold return against the index.


