adplus-dvertising
Connect with us

Economy

Countries by Share of the Global Economy

Published

 on


countries by share of the global economy in 2022


Countries by Share of the Global Economy

As 2022 comes to a close we can recap many historic milestones of the year, like the Earth’s population hitting 8 billion and the global economy surpassing $100 trillion.

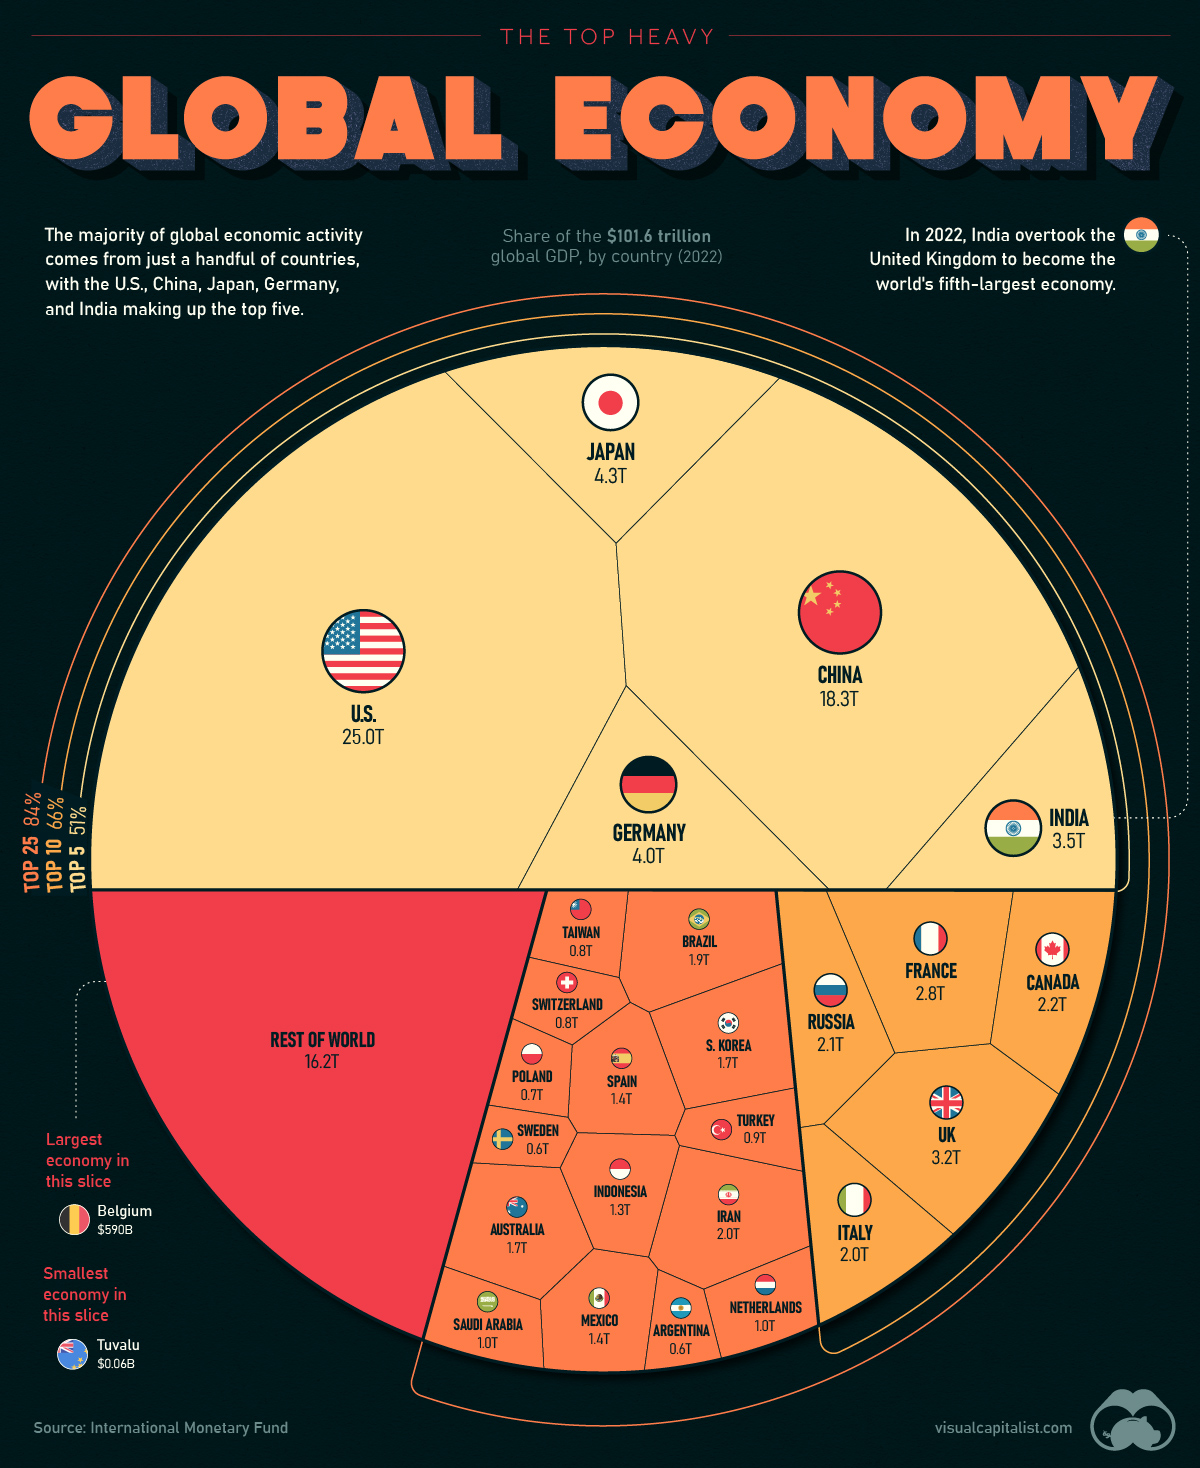
In this chart, we visualize the world’s GDP using data from the IMF, showcasing the biggest economies and the share of global economic activity that they make up.

ℹ️ Gross Domestic Product (GDP) is a broad indicator of the economic activity within a country. It measures the total value of economic output—goods and services—produced within a given time frame by both the private and public sectors.

The GDP Heavyweights

The global economy can be thought of as a pie, with the size of each slice representing the share of the Global Economy GDP contributed by each country. Currently, the largest slices of the pie are held by the United States, China, Japan, Germany, and India, which together account for more than half of global GDP.

Here’s a look at every country’s share of the world’s $101.6 trillion economy:

Rank Country GDP (Billions, USD)
#1 ???????? United States $25,035.2
#2 ???????? China $18,321.2
#3 ???????? Japan $4,300.6
#4 ???????? Germany $4,031.1
#5 ???????? India $3,468.6
#6 ???????? United Kingdom $3,198.5
#7 ???????? France $2,778.1
#8 ???????? Canada $2,200.4
#9 ???????? Russia $2,133.1
#10 ???????? Italy $1,997.0
#11 ???????? Iran $1,973.7
#12 ???????? Brazil $1,894.7
#13 ???????? South Korea $1,734.2
#14 ???????? Australia $1,724.8
#15 ???????? Mexico $1,424.5
#16 ???????? Spain $1,389.9
#17 ???????? Indonesia $1,289.4
#18 ???????? Saudi Arabia $1,010.6
#19 ???????? Netherlands $990.6
#20 ???????? Turkey $853.5
#21 ???????? Taiwan $828.7
#22 ???????? Switzerland $807.4
#23 ???????? Poland $716.3
#24 ???????? Argentina $630.7
#25 ???????? Sweden $603.9
#26 ???????? Belgium $589.5
#27 ???????? Thailand $534.8
#28 ???????? Israel $527.2
#29 ???????? Ireland $519.8
#30 ???????? Norway $504.7
#31 ???????? Nigeria $504.2
#32 ???????? United Arab Emirates $503.9
#33 ???????? Egypt $469.1
#34 ???????? Austria $468.0
#35 ???????? Bangladesh $460.8
#36 ???????? Malaysia $434.1
#37 ???????? Singapore $423.6
#38 ???????? Vietnam $413.8
#39 ???????? South Africa $411.5
#40 ???????? Philippines $401.7
#41 ???????? Denmark $386.7
#42 ???????? Pakistan $376.5
#43 ???????? Hong Kong SAR $368.4
#44 ???????? Colombia $342.9
#45 ???????? Chile $310.9
#46 ???????? Romania $299.9
#47 ???????? Czech Republic $295.6
#48 ???????? Iraq $282.9
#49 ???????? Finland $281.4
#50 ???????? Portugal $255.9
#51 ???????? New Zealand $242.7
#52 ???????? Peru $239.3
#53 ???????? Kazakhstan $224.3
#54 ???????? Greece $222.0
#55 ???????? Qatar $221.4
#56 ???????? Algeria $187.2
#57 ???????? Hungary $184.7
#58 ???????? Kuwait $183.6
#59 ???????? Morocco $142.9
#60 ???????? Angola $124.8
#61 ???????? Puerto Rico $118.7
#62 ???????? Ecuador $115.5
#63 ???????? Kenya $114.9
#64 ???????? Slovakia $112.4
#65 ???????? Dominican Republic $112.4
#66 ???????? Ethiopia $111.2
#67 ???????? Oman $109.0
#68 ???????? Guatemala $91.3
#69 ???????? Bulgaria $85.0
#70 ???????? Luxembourg $82.2
#71 ???????? Venezuela $82.1
#72 ???????? Belarus $79.7
#73 ???????? Uzbekistan $79.1
#74 ???????? Tanzania $76.6
#75 ???????? Ghana $76.0
#76 ???????? Turkmenistan $74.4
#77 ???????? Sri Lanka $73.7
#78 ???????? Uruguay $71.2
#79 ???????? Panama $71.1
#80 ???????? Azerbaijan $70.1
#81 ???????? Croatia $69.4
#82 ???????? Côte d’Ivoire $68.6
#83 ???????? Costa Rica $68.5
#84 ???????? Lithuania $68.0
#85 ???????? Democratic Republic of the Congo $63.9
#86 ???????? Serbia $62.7
#87 ???????? Slovenia $62.2
#88 ???????? Myanmar $59.5
#89 ???????? Uganda $48.4
#90 ???????? Jordan $48.1
#91 ???????? Tunisia $46.3
#92 ???????? Cameroon $44.2
#93 ???????? Bahrain $43.5
#94 ???????? Bolivia $43.4
#95 ???????? Sudan $42.8
#96 ???????? Paraguay $41.9
#97 ???????? Libya $40.8
#98 ???????? Latvia $40.6
#99 ???????? Estonia $39.1
#100 ???????? Nepal $39.0
#101 ???????? Zimbabwe $38.3
#102 ???????? El Salvador $32.0
#103 ???????? Papua New Guinea $31.4
#104 ???????? Honduras $30.6
#105 ???????? Trinidad and Tobago $29.3
#106 ???????? Cambodia $28.3
#107 ???????? Iceland $27.7
#108 ???????? Yemen $27.6
#109 ???????? Senegal $27.5
#110 ???????? Zambia $27.0
#111 ???????? Cyprus $26.7
#112 ???????? Georgia $25.2
#113 ???????? Bosnia and Herzegovina $23.7
#114 ???????? Macao SAR $23.4
#115 ???????? Gabon $22.2
#116 ???????? Haiti $20.2
#117 ???????? Guinea $19.7
#118 West Bank and Gaza $18.8
#119 ???????? Brunei $18.5
#120 ???????? Mali $18.4
#121 ???????? Burkina Faso $18.3
#122 ???????? Albania $18.3
#123 ???????? Botswana $18.0
#124 ???????? Mozambique $17.9
#125 ???????? Armenia $17.7
#126 ???????? Benin $17.5
#127 ???????? Malta $17.2
#128 ???????? Equatorial Guinea $16.9
#129 ???????? Laos $16.3
#130 ???????? Jamaica $16.1
#131 ???????? Mongolia $15.7
#132 ???????? Nicaragua $15.7
#133 ???????? Madagascar $15.1
#134 ???????? Guyana $14.8
#135 ???????? Niger $14.6
#136 ???????? Republic of Congo $14.5
#137 ???????? North Macedonia $14.1
#138 ???????? Moldova $14.0
#139 ???????? Chad $12.9
#140 ???????? The Bahamas $12.7
#141 ???????? Namibia $12.5
#142 ???????? Rwanda $12.1
#143 ???????? Malawi $11.6
#144 ???????? Mauritius $11.5
#145 ???????? Mauritania $10.1
#146 ???????? Tajikistan $10.0
#147 ???????? Kyrgyzstan $9.8
#148 ???????? Kosovo $9.2
#149 ???????? Somalia $8.4
#150 ???????? Togo $8.4
#151 ???????? Montenegro $6.1
#152 ???????? Maldives $5.9
#153 ???????? Barbados $5.8
#154 ???????? Fiji $4.9
#155 ???????? South Sudan $4.8
#156 ???????? Eswatini $4.7
#157 ???????? Sierra Leone $4.1
#158 ???????? Liberia $3.9
#159 ???????? Djibouti $3.7
#160 ???????? Burundi $3.7
#161 ???????? Aruba $3.5
#162 ???????? Andorra $3.3
#163 ???????? Suriname $3.0
#164 ???????? Bhutan $2.7
#165 ???????? Belize $2.7
#166 ???????? Lesotho $2.5
#167 ???????? Central African Republic $2.5
#168 ???????? Timor-Leste $2.4
#169 ???????? Eritrea $2.4
#170 ???????? The Gambia $2.1
#171 ???????? Cabo Verde $2.1
#172 ???????? Seychelles $2.0
#173 ???????? St. Lucia $2.0
#174 ???????? Antigua and Barbuda $1.7
#175 ???????? Guinea-Bissau $1.6
#176 ???????? San Marino $1.6
#177 ???????? Solomon Islands $1.6
#178 ???????? Comoros $1.2
#179 ???????? Grenada $1.2
#180 ???????? St. Kitts and Nevis $1.1
#181 ???????? Vanuatu $1.0
#182 ???????? St. Vincent and the Grenadines $1.0
#183 ???????? Samoa $0.83
#184 ???????? Dominica $0.60
#185 ???????? São Tomé and Príncipe $0.51
#186 ???????? Tonga $0.50
#187 ???????? Micronesia $0.43
#188 ???????? Marshall Islands $0.27
#189 ???????? Palau $0.23
#190 ???????? Kiribati $0.21
#191 ???????? Nauru $0.13
#192 ???????? Tuvalu $0.06
#193 ???????? Ukraine Data not available
Total World GDP $101,559.3

Just five countries make up more than half of the world’s entire GDP in 2022: the U.S., China, Japan, India, and Germany. Interestingly, India replaced the UK this year as a top five economy.

Adding on another five countries (the top 10) makes up 66% of the global economy, and the top 25 countries comprise 84% of global GDP.

The World’s Smallest Economies

The rest of the world — the remaining 167 nations — make up 16% of the global GDP. Many of the smallest economies are islands located in Oceania.

Here’s a look at the 20 smallest economies in the world:

Country GDP (Billions, USD)
???????? Tuvalu $0.06
???????? Nauru $0.13
???????? Kiribati $0.21
???????? Palau $0.23
???????? Marshall Islands $0.27
???????? Micronesia $0.43
???????? Tonga $0.50
???????? São Tomé and Príncipe $0.51
???????? Dominica $0.60
???????? Samoa $0.83
???????? St. Vincent and the Grenadines $0.95
???????? Vanuatu $0.98
???????? St. Kitts and Nevis $1.12
???????? Grenada $1.19
???????? Comoros $1.24
???????? Solomon Islands $1.60
???????? San Marino $1.62
???????? Guinea-Bissau $1.62
???????? Antigua and Barbuda $1.69
???????? St. Lucia $1.97

Tuvalu has the smallest GDP of any country at just $64 million. Tuvalu is one of a dozen nations with a GDP of less than one billion dollars.

The Global Economy in 2023

Heading into 2023, there is much economic uncertainty. Many experts are anticipating a brief recession, although opinions differ on the definition of “brief”.

Some experts believe that China will buck the trend of economic downturn. If this prediction comes true, the country could own an even larger slice of the Global Economy GDP pie in the near future.

????????????
Speaking of predictions, we’re creating the ultimate cheatsheet for 2023.
See what hundreds of experts are predicting for 2023 with our Global Forecast Series.
728x90x4

Source link

Continue Reading

Economy

Canada’s unemployment rate holds steady at 6.5% in October, economy adds 15,000 jobs

Published

 on


OTTAWA – Canada’s unemployment rate held steady at 6.5 per cent last month as hiring remained weak across the economy.

Statistics Canada’s labour force survey on Friday said employment rose by a modest 15,000 jobs in October.

Business, building and support services saw the largest gain in employment.

Meanwhile, finance, insurance, real estate, rental and leasing experienced the largest decline.

Many economists see weakness in the job market continuing in the short term, before the Bank of Canada’s interest rate cuts spark a rebound in economic growth next year.

Despite ongoing softness in the labour market, however, strong wage growth has raged on in Canada. Average hourly wages in October grew 4.9 per cent from a year ago, reaching $35.76.

Friday’s report also shed some light on the financial health of households.

According to the agency, 28.8 per cent of Canadians aged 15 or older were living in a household that had difficulty meeting financial needs – like food and housing – in the previous four weeks.

That was down from 33.1 per cent in October 2023 and 35.5 per cent in October 2022, but still above the 20.4 per cent figure recorded in October 2020.

People living in a rented home were more likely to report difficulty meeting financial needs, with nearly four in 10 reporting that was the case.

That compares with just under a quarter of those living in an owned home by a household member.

Immigrants were also more likely to report facing financial strain last month, with about four out of 10 immigrants who landed in the last year doing so.

That compares with about three in 10 more established immigrants and one in four of people born in Canada.

This report by The Canadian Press was first published Nov. 8, 2024.

The Canadian Press. All rights reserved.

Source link

Continue Reading

Economy

Health-care spending expected to outpace economy and reach $372 billion in 2024: CIHI

Published

 on


The Canadian Institute for Health Information says health-care spending in Canada is projected to reach a new high in 2024.

The annual report released Thursday says total health spending is expected to hit $372 billion, or $9,054 per Canadian.

CIHI’s national analysis predicts expenditures will rise by 5.7 per cent in 2024, compared to 4.5 per cent in 2023 and 1.7 per cent in 2022.

This year’s health spending is estimated to represent 12.4 per cent of Canada’s gross domestic product. Excluding two years of the pandemic, it would be the highest ratio in the country’s history.

While it’s not unusual for health expenditures to outpace economic growth, the report says this could be the case for the next several years due to Canada’s growing population and its aging demographic.

Canada’s per capita spending on health care in 2022 was among the highest in the world, but still less than countries such as the United States and Sweden.

The report notes that the Canadian dental and pharmacare plans could push health-care spending even further as more people who previously couldn’t afford these services start using them.

This report by The Canadian Press was first published Nov. 7, 2024.

Canadian Press health coverage receives support through a partnership with the Canadian Medical Association. CP is solely responsible for this content.

The Canadian Press. All rights reserved.

Source link

Continue Reading

Economy

Trump’s victory sparks concerns over ripple effect on Canadian economy

Published

 on


As Canadians wake up to news that Donald Trump will return to the White House, the president-elect’s protectionist stance is casting a spotlight on what effect his second term will have on Canada-U.S. economic ties.

Some Canadian business leaders have expressed worry over Trump’s promise to introduce a universal 10 per cent tariff on all American imports.

A Canadian Chamber of Commerce report released last month suggested those tariffs would shrink the Canadian economy, resulting in around $30 billion per year in economic costs.

More than 77 per cent of Canadian exports go to the U.S.

Canada’s manufacturing sector faces the biggest risk should Trump push forward on imposing broad tariffs, said Canadian Manufacturers and Exporters president and CEO Dennis Darby. He said the sector is the “most trade-exposed” within Canada.

“It’s in the U.S.’s best interest, it’s in our best interest, but most importantly for consumers across North America, that we’re able to trade goods, materials, ingredients, as we have under the trade agreements,” Darby said in an interview.

“It’s a more complex or complicated outcome than it would have been with the Democrats, but we’ve had to deal with this before and we’re going to do our best to deal with it again.”

American economists have also warned Trump’s plan could cause inflation and possibly a recession, which could have ripple effects in Canada.

It’s consumers who will ultimately feel the burden of any inflationary effect caused by broad tariffs, said Darby.

“A tariff tends to raise costs, and it ultimately raises prices, so that’s something that we have to be prepared for,” he said.

“It could tilt production mandates. A tariff makes goods more expensive, but on the same token, it also will make inputs for the U.S. more expensive.”

A report last month by TD economist Marc Ercolao said research shows a full-scale implementation of Trump’s tariff plan could lead to a near-five per cent reduction in Canadian export volumes to the U.S. by early-2027, relative to current baseline forecasts.

Retaliation by Canada would also increase costs for domestic producers, and push import volumes lower in the process.

“Slowing import activity mitigates some of the negative net trade impact on total GDP enough to avoid a technical recession, but still produces a period of extended stagnation through 2025 and 2026,” Ercolao said.

Since the Canada-United States-Mexico Agreement came into effect in 2020, trade between Canada and the U.S. has surged by 46 per cent, according to the Toronto Region Board of Trade.

With that deal is up for review in 2026, Canadian Chamber of Commerce president and CEO Candace Laing said the Canadian government “must collaborate effectively with the Trump administration to preserve and strengthen our bilateral economic partnership.”

“With an impressive $3.6 billion in daily trade, Canada and the United States are each other’s closest international partners. The secure and efficient flow of goods and people across our border … remains essential for the economies of both countries,” she said in a statement.

“By resisting tariffs and trade barriers that will only raise prices and hurt consumers in both countries, Canada and the United States can strengthen resilient cross-border supply chains that enhance our shared economic security.”

This report by The Canadian Press was first published Nov. 6, 2024.

The Canadian Press. All rights reserved.

Source link

Continue Reading

Trending