Science
Asteroid danger! Menacing 590-foot Asteroid 2023 CM dashing towards Earth


|
A warning has been issued about an asteroid which will pass Earth at an alarmingly close distance. Although scientists have determined that there is no risk of impact as of yet, the asteroid’s close approach serves as a reminder of the potential danger that asteroids can pose to our planet. NASA, ESA and other space agencies continue to keep a watch on Near-Earth Objects which have the potential to collide with our planet. If these objects come within 8 million kilometers of Earth, they are classified as Potentially Hazardous Objects.
NASA has now warned that an asteroid is speeding towards Earth and it is expected to come shockingly close to the planet today, March 14.
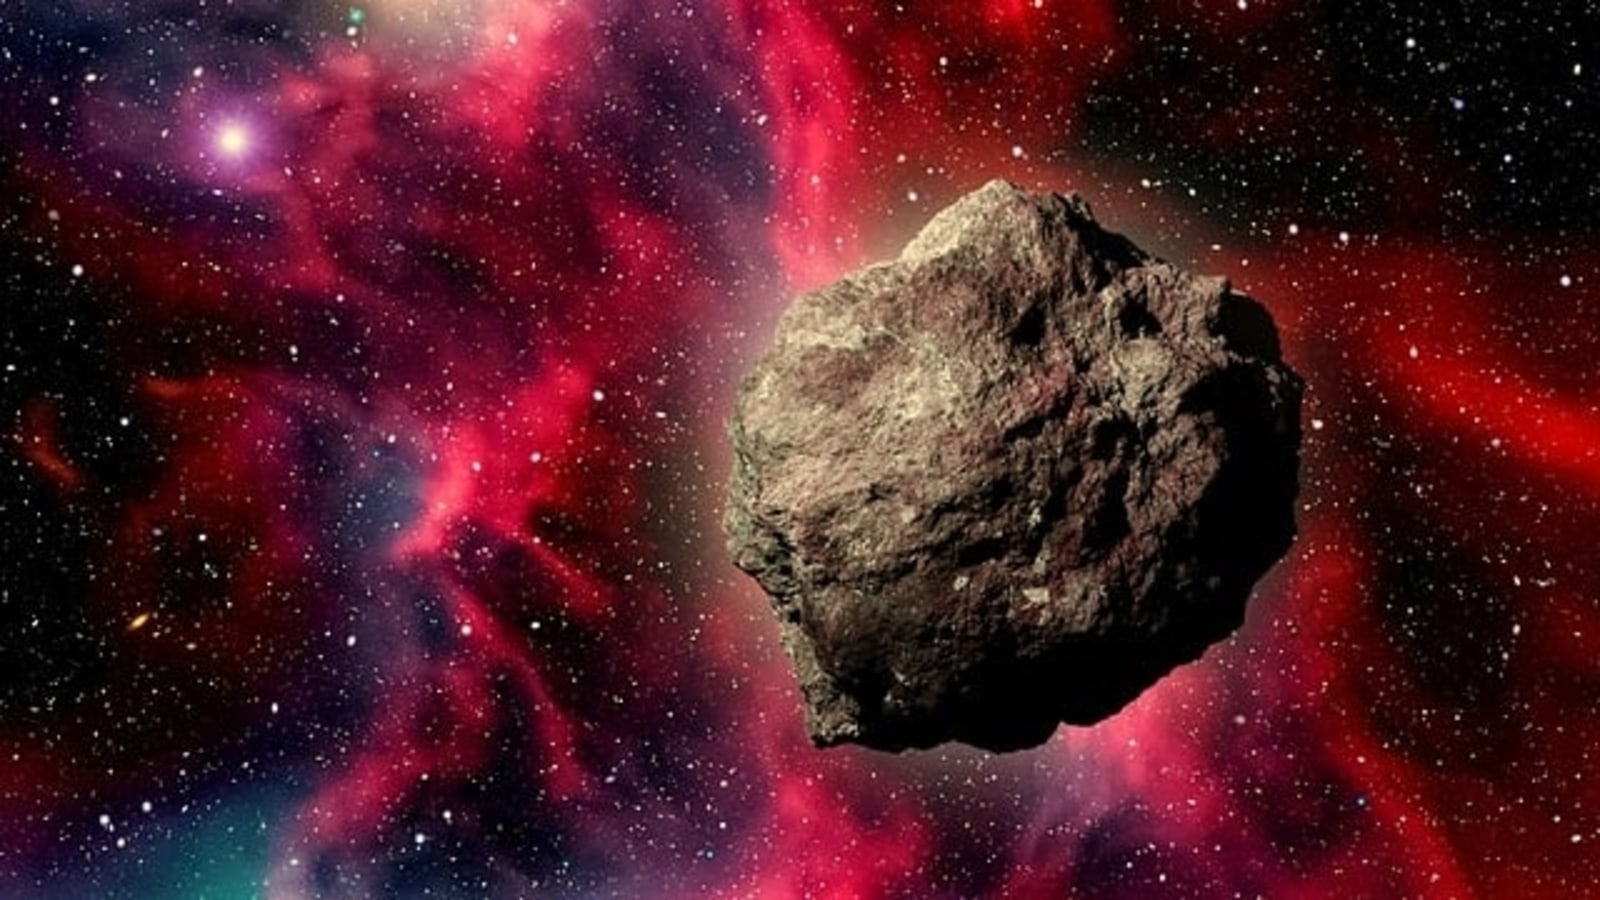
Asteroid 2023 CM details
The asteroid has been named Asteroid 2023 CM by NASA’s Center for Near-Earth Object Studies. The same organization has also revealed its trajectory, distance of close approach and expected speed. Asteroid 2023 CM will pass Earth today, March 14, at a distance of just 3.9 million kilometers. What’s alarming about this asteroid is its mammoth size. NASA estimates the asteroid to be nearly 590 feet wide, which makes it almost as big as a skyscraper!
In fact, NASA has revealed that this space rock is already rushing towards the planet, travelling at a fearsome speed of 50496 kilometers per hour.
Asteroid fun facts
1. Most of the asteroids can be found in a specific region in space. It is called the asteroid belt – a region between the orbits of Mars and Jupiter.
2. Asteroids are usually made up of rocks, but they can also be made of metals such as nickel and iron, or even clay!
3. More than 150 asteroids are known to have a small companion moon, or even two moons!
4. Asteroids were considered as planets until the middle of the 19th century!
5. An asteroid was responsible for triggering the extinction of dinosaurs when it crashed on Earth near the Yucatán Peninsula in Mexico more than 65 million years ago.


Science
By cracking a metal 3D-printing conundrum, researchers propel the technology toward widespread application – EurekAlert
image: Researchers used high-speed X-ray diffraction to identify the crystal structures that form within steel as it is 3D-printed. The angle at which the X-rays exit the metal correspond to types of crystal structures within.
view more
Credit: H. König et al. via Creative Commons (https://creativecommons.org/licenses/by/4.0/), adapted by N. Hanacek/NIST
Researchers have not yet gotten the additive manufacturing, or 3D printing, of metals down to a science completely. Gaps in our understanding of what happens within metal during the process have made results inconsistent. But a new breakthrough could grant an unprecedented level of mastery over metal 3D printing.
Using two different particle accelerator facilities, researchers at the National Institute of Standards and Technology (NIST), KTH Royal Institute of Technology in Sweden and other institutions have peered into the internal structure of steel as it was melted and then solidified during 3D printing. The findings, published in Acta Materialia, unlock a computational tool for 3D-printing professionals, offering them a greater ability to predict and control the characteristics of printed parts, potentially improving the technology’s consistency and feasibility for large-scale manufacturing.
A common approach for printing metal pieces involves essentially welding pools of powdered metal with lasers, layer by layer, into a desired shape. During the first steps of printing with a metal alloy, wherein the material rapidly heats up and cools off, its atoms — which can be a smattering of different elements — pack into ordered, crystalline formations. The crystals determine the properties, such as toughness and corrosion resistance, of the printed part. Different crystal structures can emerge, each with their own pros and cons.
“Basically, if we can control the microstructure during the initial steps of the printing process, then we can obtain the desired crystals and, ultimately, determine the performance of additively manufactured parts,” said NIST physicist Fan Zhang, a study co-author.
While the printing process wastes less material and can be used to produce more complicated shapes than traditional manufacturing methods, researchers have struggled to grasp how to steer metal toward particular kinds of crystals over others.
This lack of knowledge has led to less than desirable results, such as parts with complex shapes cracking prematurely thanks to their crystal structure.
“Among the thousands of alloys that are commonly manufactured, only a handful can be made using additive manufacturing,” Zhang said.
Part of the challenge for scientists has been that solidification during metal 3D printing occurs in the blink of an eye.
To capture the high-speed phenomenon, the authors of the new study employed powerful X-rays generated by cyclic particle accelerators, called synchrotrons, at Argonne National Laboratory’s Advanced Photon Source and the Paul Scherrer Institute’s Swiss Light Source.
The team sought to learn how the cooling rates of metal, which can be controlled by laser power and movement settings, influence crystal structure. Then the researchers would compare the data to the predictions of a widely used computational model developed in the ’80s that describes the solidification of alloys.
While the model is trusted for traditional manufacturing processes, the jury has been out on its applicability in the unique context of 3D printing’s rapid temperature shifts.
“Synchrotron experiments are time consuming and expensive, so you cannot run them for every condition that you’re interested in. But they are very useful for validating models that you then can use to simulate the interesting conditions,” said study co-author Greta Lindwall, an associate professor of materials science and engineering at KTH Royal Institute of Technology.
Within the synchrotrons, the authors set up additive manufacturing conditions for hot-work tool steel — a kind of metal used to make, as the name suggests, tools that can withstand high temperatures.
As lasers liquified the metal and different crystals emerged, X-ray beams probed the samples with enough energy and speed to produce images of the fleeting process. The team members required two separate facilities to support the cooling rates they wanted to test, which ranged from temperatures of tens of thousands to more than a million kelvins per second.
The data the researchers collected depicted the push and pull between two kinds of crystal structures, austenite and delta ferrite, the latter being associated with cracking in printed parts. As cooling rates surpassed 1.5 million kelvins (2.7 million degrees Fahrenheit) per second, austenite began to dominate its rival. This critical threshold lined up with what the model foretold.
“The model and the experimental data are nicely in agreement. When we saw the results, we were really excited,” Zhang said.
The model has long been a reliable tool for materials design in traditional manufacturing, and now the 3D-printing space may be afforded the same support.
The results indicate that the model can inform scientists and engineers on what cooling rates to select for the early solidification steps of the printing process. That way the optimal crystal structure would appear within their desired material, making metal 3D printing less of a roll of the dice.
“If we have data, we can use it to validate the models. That’s how you accelerate the widespread adoption of additive manufacturing for industrial use,” Zhang said.
Disclaimer: AAAS and EurekAlert! are not responsible for the accuracy of news releases posted to EurekAlert! by contributing institutions or for the use of any information through the EurekAlert system.
Science
Deep Impact: Heat Waves Happen at the Bottom of the Ocean Too
|
This visualization depicts bathymetric features of the western Atlantic Ocean Basin, including the continental shelf, captured by satellite. Credit: NOAA’s National Environmental Satellite and Information Service
First assessment of bottom marine heat waves opens a window on the deep.
The 2013-2016 marine heat wave known as “The Blob” warmed a vast expanse of surface waters across the northeastern Pacific, disrupting West Coast marine ecosystems, depressing salmon returns, and damaging commercial fisheries. It also prompted a wave of research on extreme warming of ocean surface waters.
But, as new research from the National Oceanic and Atmospheric Administration (<span class=”glossaryLink” aria-describedby=”tt” data-cmtooltip=”
In a paper published in the journal <span class=”glossaryLink” aria-describedby=”tt” data-cmtooltip=”
” data-gt-translate-attributes=”[“attribute”:”data-cmtooltip”, “format”:”html”]”>Nature Communications on March 13, a team led by NOAA researchers used a combination of observations and computer models to generate the first broad assessment of bottom marine heat waves in the productive continental shelf waters surrounding North America.
Marine heat waves have a significant impact on ocean ecosystems globally, disrupting the productivity and distribution of organisms, from plankton to whales. There is a significant effort to study, track, and predict the timing, intensity, duration, and physical drivers of these events. Credit: NOAA Fisheries
“Researchers have been investigating marine heat waves at the sea surface for over a decade now,” said lead author Dillon Amaya, a research scientist with NOAA’s Physical Science Laboratory. “This is the first time we’ve been able to really dive deeper and assess how these extreme events unfold along shallow seafloors.”
Marine heat waves dramatically impact the health of ocean ecosystems around the globe, disrupting the productivity and distribution of organisms as small as plankton and as large as whales. As a result, there has been a considerable effort to study, track and predict the timing, intensity, duration, and physical drivers of these events.
Most of that research has focused on temperature extremes at the ocean’s surface, for which there are many more high-quality observations taken by satellites, ships, and buoys. Sea surface temperatures can also be indicators for many physical and biochemical ocean characteristics of sensitive marine ecosystems, making analyses more straightforward.
About 90% of the excess heat from global warming has been absorbed by the ocean, which has warmed by about 1.5C over the past century. Marine heatwaves have become about 50% more frequent over the past decade.
Ling cod, like this one caught off of Humboldt Bay Jetty in California, are a member of Pacific groundfish communities vulnerable to impacts from bottom marine heat waves. Credit: Nicholas Easterbrook/NOAA Fisheries
In recent years, scientists have increased efforts to investigate marine heat waves throughout the water column using the limited data available. But previous research didn’t target temperature extremes on the ocean bottom along continental shelves, which provide critical habitat for important commercial <span class=”glossaryLink” aria-describedby=”tt” data-cmtooltip=”
Due to the relative scarcity of bottom-water temperature datasets, the scientists used a data product called “reanalysis” to conduct the assessment, which starts with available observations and employs computer models that simulate ocean currents and the influence of the atmosphere to “fill in the blanks.” Using a similar technique, NOAA scientists have been able to reconstruct global weather back to the early 19th century.
These illustrations show the average intensity of bottom heat waves ( heat anomalies) that occurred between 1993 and 2019 in each of the large marine ecosystems studied by a team of NOAA scientists. Credit: NOAA Physical Sciences Laboratory
While ocean reanalyses have been around for a long time, they have only recently become skillful enough and have high enough resolution to examine ocean features, including bottom temperatures, near the coast.
The research team, from NOAA, Cooperative Institute for Research in Environmental Sciences (CIRES), and National Center for Atmospheric Research (NCAR), found that on the continental shelves around North America, bottom marine heat waves tend to persist longer than their surface counterparts, and can have larger warming signals than the overlying surface waters. Bottom and surface marine heat waves can occur simultaneously in the same location, especially in shallower regions where surface and bottom waters mingle.
Lionfish have become a poster child for invasive species issues in the western north Atlantic region. Their populations continue to expand, threatening the well-being of coral reefs and other marine ecosystems. This includes the commercially and recreationally important fish that depend on them. Credit: NOAA Fisheries
But bottom marine heat waves can also occur with little or no evidence of warming at the surface, which has important implications for the management of commercially important fisheries. “That means it can be happening without managers realizing it until the impacts start to show,” said Amaya.
In 2015, a combination of harmful algal blooms and loss of kelp forest habitat off the West Coast of the United States—both caused by The Blob – led to closures of shellfisheries that cost the economy in excess of $185 million, according to a 2021 study. The commercial tri-state Dungeness crab fishery recorded a loss of $97.5 million, affecting both tribal and nontribal fisheries. Washington and Californian coastal communities lost a combined $84 million in tourist spending due to the closure of recreational razor clam and abalone fisheries.
In 2021, a groundfish survey published by NOAA Fisheries indicated that Gulf of Alaska cod had plummeted during The Blob, experiencing a 71% decline in abundance between 2015 and 2017. On the other hand, young groundfish and other marine creatures in the Northern California Current system thrived under the unprecedented ocean conditions, a 2019 paper by Oregon State University and NOAA Fisheries researchers found.
Unusually warm bottom water temperatures have also been linked to the expansion of invasive lionfish along the southeast U.S., coral bleaching and subsequent declines of reef fish, changes in survival rates of young Atlantic cod, and the disappearance of near-shore lobster populations in southern New England.
The authors say it will be important to maintain existing continental shelf monitoring systems and to develop new real-time monitoring capabilities to alert marine resource managers to bottom warming conditions.
“We know that early recognition of marine heat waves is needed for proactive management of the coastal ocean,” said co-author Michael Jacox, a research oceanographer who splits his time between NOAA’s Southwest Fisheries Science Center and the Physical Sciences Laboratory. “Now it’s clear that we need to pay closer attention to the ocean bottom, where some of the most valuable species live and can experience heat waves quite different from those on the surface.”
Reference: “Bottom marine heatwaves along the continental shelves of North America” by Dillon J. Amaya, Michael G. Jacox, Michael A. Alexander, James D. Scott, Clara Deser, Antonietta Capotondi and Adam S. Phillips, 13 March 2023, Nature Communications.
DOI: 10.1038/s41467-023-36567-0


Science
The SpaceX steamroller has shifted into a higher gear this year


|
Is it possible that SpaceX has succeeded in making orbital launches boring? Increasingly, the answer to this question appears to be yes.
On Friday the California-based company launched two Falcon 9 rockets within the span of just a little more than four hours. At 12:26 pm local time, a Falcon 9 rocket carried 52 of SpaceX’s own Starlink satellites into low-Earth orbit from a launch pad at Vandenberg Space Force Base in California. A mere 4 hours and 12 minutes later, another Falcon 9 rocket delivered two large communications satellites into geostationary transfer orbit for the Luxembourg-based satellite company SES from Kennedy Space Center.
This broke SpaceX’s own record for the shortest time duration between two launches. However, the overall record for the lowest time between two launches of the same rocket still belongs to the Russian-built Soyuz vehicle. In June 2013, Roscosmos launched a Soyuz booster from Kazakhstan, and Arianespace launched a Soyuz from French Guiana within two hours. Those launches were conducted by two separate space agencies, on separate continents, however.
Accelerating cadence
Friday’s launch of the two SES satellites was, overall, SpaceX’s 19th orbital mission for the calendar year. As of today, the company is launching a Falcon rocket every 4.1 days and remains on pace to launch approximately 90 rockets before the end of 2023.
To put this into perspective, a decade ago, the United States launched an average of 15 to 20 orbital rockets a year, total. In 2022, the United States recorded its most launches in any calendar year, ever, with 78 orbital flights. This year, barring a catastrophic accident with the Falcon 9 booster, that number will easily get into triple digits. The all-time record for orbital launches in a single year is held by the Soviet Union, with 101, in 1982.
A decade ago, SpaceX was still an upstart in the global launch industry. In the year 2013, it launched the Falcon 9 rocket a grand total of three times in a single year for the first time. This was actually a pretty monumental achievement for the company, as it introduced both its second launch pad at Vandenberg Air Force Base and a substantially upgraded variant, 1.1, of the Falcon 9 rocket. It also flew commercial missions for the first time and began experimenting with ocean-based landings.
In that competitive environment a decade ago, SpaceX still lagged far behind its main competitors, including Roscosmos, Europe-based Arianespace, and US-based United Launch Alliance. This year those numbers have swung massively around. Through today, Russia has launched three rockets, two Soyuz and one Proton, in 2023. Arianespace has yet to launch a single mission, and nor has United Launch Alliance.
No longer a competition
Put another way, SpaceX’s main competitors over the last decade have launched three rockets this year. SpaceX, by comparison, just launched three rockets in three days, including the CRS-27 mission flown for NASA on the evening of March 14. Increasingly, only the combined efforts of China’s government and its nascent commercial launch sector can pose a challenge to SpaceX’s launch dominance. That nation has a total of 11 orbital launches this year.
SpaceX founder Elon Musk has said he would like the launch industry to achieve airline-like operations with rockets one day. His company is not there yet, as it takes a couple of weeks to land, refurbish, and relaunch a Falcon 9 first stage. Each mission still requires a brand-new second stage. And the fastest turnaround time at its three launch pads, Cape Canaveral and Kennedy Space Center in Florida, and Vandenberg in California, is still about a week for each facility.
But they sure have come a long way in a decade.


-
Sports23 hours ago
UPEI coach defends team’s actions at the U Sports Men’s Hockey National Championship
-
Business24 hours ago
Canada among central banks banding together to calm markets after UBS deal to buy Credit Suisse
-
Media16 hours ago
Elon Musk roasted for bizarre social media posts about Taylor Swift: ‘Stay away from her’
-
Sports19 hours ago
Quick Reaction: Raptors 111, Bucks 118
-
Business17 hours ago
Investors punish UBS after Credit Suisse rescue, shares plummet
-
Politics20 hours ago
Algorithms are moulding and shaping our politics. Here’s how to avoid being gamed
-
Science18 hours ago
Scientists Identify Intense Heatwaves At The Bottom Of Ocean
-
Business19 hours ago
UBS to buy Credit Suisse in effort to create stability, Swiss president says