


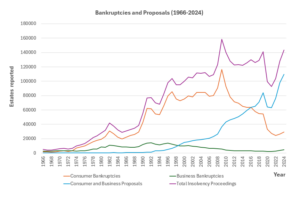

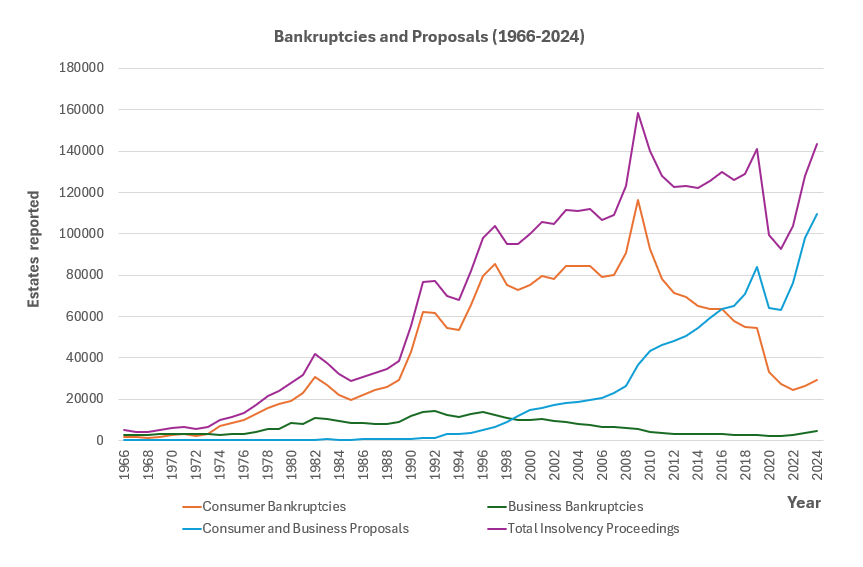
Canadians filed more consumer bankruptcies and proposals over the past year, but the provinces where unemployment fell the most did not see fewer filings. A Canada News Media comparison of federal insolvency records and Statistics Canada labour data finds almost no relationship between the two.
The Office of the Superintendent of Bankruptcy reports that consumer insolvencies rose 5.8 per cent in the 12 months ending Aug. 31, 2026, compared with the 12 months before. Consumer bankruptcies rose 9.5 per cent and consumer proposals rose 4.8 per cent. Business insolvencies fell 6.6 per cent over the same period. Over the same two periods, the national unemployment rate, using Statistics Canada’s seasonally adjusted monthly Labour Force Survey figures, averaged 6.68 per cent, down slightly from 6.81 per cent.
Province by province
| Province | Average unemployment rate, prior 12 months | Average unemployment rate, 12 months to Aug. 2026 | Consumer insolvencies, 12 months to Aug. 2026 | Change from prior 12 months |
|---|---|---|---|---|
| Alberta | 7.29% | 6.84% | 18,947 | -0.6% |
| British Columbia | 6.02% | 6.45% | 16,470 | 13.8% |
| Manitoba | 5.82% | 5.62% | 4,179 | 9.4% |
| New Brunswick | 7.03% | 7.12% | 3,591 | 2.2% |
| Newfoundland and Labrador | 10.24% | 9.60% | 2,405 | 0.1% |
| Nova Scotia | 6.51% | 6.56% | 4,340 | 1.2% |
| Ontario | 7.57% | 7.38% | 56,333 | 8.6% |
| Prince Edward Island | 7.96% | 7.62% | 650 | 13.4% |
| Quebec | 5.72% | 5.52% | 35,418 | 3.1% |
| Saskatchewan | 5.14% | 5.78% | 3,642 | 0.2% |
Ontario’s average unemployment rate slipped from 7.57 per cent to 7.38 per cent, yet consumer insolvencies there rose 8.6 per cent to 56,333. Manitoba’s rate fell from 5.82 per cent to 5.62 per cent while filings rose 9.4 per cent. Prince Edward Island’s rate fell from 7.96 per cent to 7.62 per cent while filings rose 13.4 per cent. British Columbia, where the average rate rose from 6.02 per cent to 6.45 per cent, had the largest increase among the provinces, 13.8 per cent. Saskatchewan shows the reverse: its average unemployment rate rose from 5.14 per cent to 5.78 per cent, the biggest jump in the country, while its consumer filings were essentially flat (up 0.2 per cent). Alberta’s rate fell from 7.29 per cent to 6.84 per cent and its filings dipped 0.6 per cent.
Across the 10 provinces, the correlation between the change in average unemployment and the change in consumer insolvencies is 0.10, close to zero. That is a small sample, and it describes these two 12-month windows only, but it does not support the idea that job losses alone explain where filings are climbing.
What this does and does not show
The comparison does not identify why filings are rising. It does not adjust for population, and insolvency counts reflect where a person files, not necessarily where the debt was incurred. The Labour Force Survey is a sample survey with a margin of error, and the Office of the Superintendent of Bankruptcy notes that monthly insolvency counts vary widely and that its figures are updated over time. The territories are not shown because their counts are too small to compare; the Northwest Territories recorded 72 consumer filings in the latest 12 months. Yukon and Nunavut are not covered in the figures we extracted.
What it means for you
Rising filings in provinces with steady or falling unemployment suggest that debt stress is not confined to people who have lost jobs. Anyone struggling with payments can speak to a Licensed Insolvency Trustee, who is federally licensed and can explain the options, including consumer proposals, before any filing. The Office of the Superintendent of Bankruptcy publishes a directory of trustees on its website.
How we did this
We took the provincial totals from Table 2 (BIA insolvencies filed by consumers) of the Office of the Superintendent of Bankruptcy’s Insolvency Statistics in Canada, August 2026 report, using the 12-month periods ending Aug. 31, 2026 and Aug. 31, 2025. We averaged the monthly seasonally adjusted unemployment rate for all genders, 15 years and over, from Statistics Canada Table 14-10-0287-01 over the same two 12-month windows (September to August), and computed the Pearson correlation between the change in the average rate and the percentage change in filings across the 10 provinces. The source tables and calculations are saved in our files. No organization is accused of anything in this analysis, so we did not seek responses. Corrections and questions can be sent to the newsroom.
Follow Canada News Media
Get the day's top Canadian stories and our two daily 60-second news videos wherever you scroll.
X Threads Facebook Instagram LinkedIn TikTok YouTube Pinterest Reddit Substack Flipboard Newsletter RSS