


Only about 4.5 per cent of Toronto’s rental apartments and townhouses rent for an amount a bottom-fifth-income renter household can afford, and almost none of them are empty, according to tables in the Canada Mortgage and Housing Corporation’s 2025 Rental Market Report. In the Toronto census metropolitan area, 15,580 of 343,539 private apartment and row units in the survey fell in the lowest affordability band, rents under $1,099 a month, and 0.8 per cent of them were vacant in October 2025. For units priced for households earning $96,000 to $145,000, the vacancy rate was 5.3 per cent. The metro-wide rate was 3.0 per cent.
CMHC’s table sorts every surveyed unit by the household income needed to afford its rent at 30 per cent of income, using five renter-income groups. The first group, Q1, is renters earning under about $44,000 in Toronto and Ottawa, $43,000 in Calgary, $39,000 in Vancouver and $33,000 in Montréal, with the cut-off varying by province. We pulled the metro-wide row for each of the 18 metros CMHC published. Q1 units were a small slice of the stock almost everywhere they were reported: 1.7 per cent in Calgary (1,141 units), 2.4 per cent in Vancouver (3,045 of 129,351), 3.9 per cent in Saskatoon, 4.5 per cent in Toronto, 8.4 per cent in Ottawa (7,483 of 89,170), 8.7 per cent in Winnipeg, 14.3 per cent in Montréal (95,844 of 668,834), 22.5 per cent in Windsor and 32.2 per cent in Québec (38,454 of 119,528). CMHC suppressed the Q1 count for Edmonton, Gatineau and Regina.
Where the Q1 vacancy rate was published, it was lower than the metro’s overall rate in 13 of 14 metros. Ottawa and Toronto were at 0.8 per cent, Victoria 0.7, Halifax 1.0, Québec 1.3, Montréal 1.5, Vancouver 1.6, Winnipeg 1.9 and London 2.0, against overall rates of 2.9, 3.0, 3.3, 2.5, 2.4, 3.0, 3.7, 2.7 and 3.9 per cent. The exception was Edmonton, where the Q1 rate was 4.7 per cent against 3.9 per cent overall, a figure CMHC rates as poor quality and to be used with caution. In Calgary, Hamilton, Kitchener-Cambridge-Waterloo and Gatineau the Q1 vacancy rate was suppressed.
The vacancies sit higher up the price ladder. For the group priced for households earning roughly $96,000 to $145,000 in Toronto (Q4), vacancy was above each metro’s overall rate in 14 of 16 metros where it was published, equal in Saskatoon and lower in Regina. Q4 vacancy was 7.2 per cent in Ottawa, 6.7 in Vancouver, 5.9 in Montréal, 5.3 in Toronto and Victoria, and 9.5 in Calgary, where the overall rate was 5.2 per cent.
The tables do not show who lives in these units. A low-rent apartment is not necessarily rented by a low-income household, and CMHC’s bands describe what a household in each income group could afford, not what it pays. The survey covers privately owned rental buildings and townhouses with rent data and leaves out social and subsidized housing. Vacancy is a count on one survey week, not a measure of how long a unit stays empty or of how many cheaper apartments are advertised. A rate of 0.8 per cent on 15,580 Toronto units works out to roughly 125 empty units, and several Q1 figures elsewhere rest on small counts that CMHC flags as less reliable. We have not tested why cheaper units are scarce, and nothing here assigns blame to any landlord or government.
How we checked: We downloaded the 18 metropolitan data workbooks that CMHC links from its 2025 Rental Market Report page on Nov. 17, 2026 and read table 3.1.8, “Private Row (Townhouse) and Apartment Vacancy Rate (%) and Universe by Household Income Quintiles / Monthly Rent Below 30% of Income Quintile,” taking the metro-wide rows. Shares are each band’s unit count divided by the metro total in the same table; counts and rates are as CMHC published them, and we left out any cell it suppressed. CMHC says renter income comes from the 2021 Census, grown by provincial median weekly wage growth, for non-subsidized households of all sizes. The October 2025 survey is the latest in the series; CMHC’s 2026 survey had not been released when we checked. Percentages and the 13-of-14 and 14-of-16 comparisons are our calculations. No organization or person is accused of wrongdoing in this analysis.
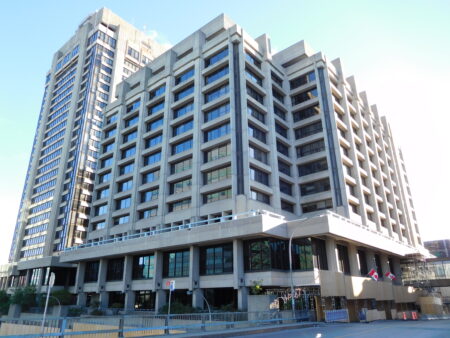
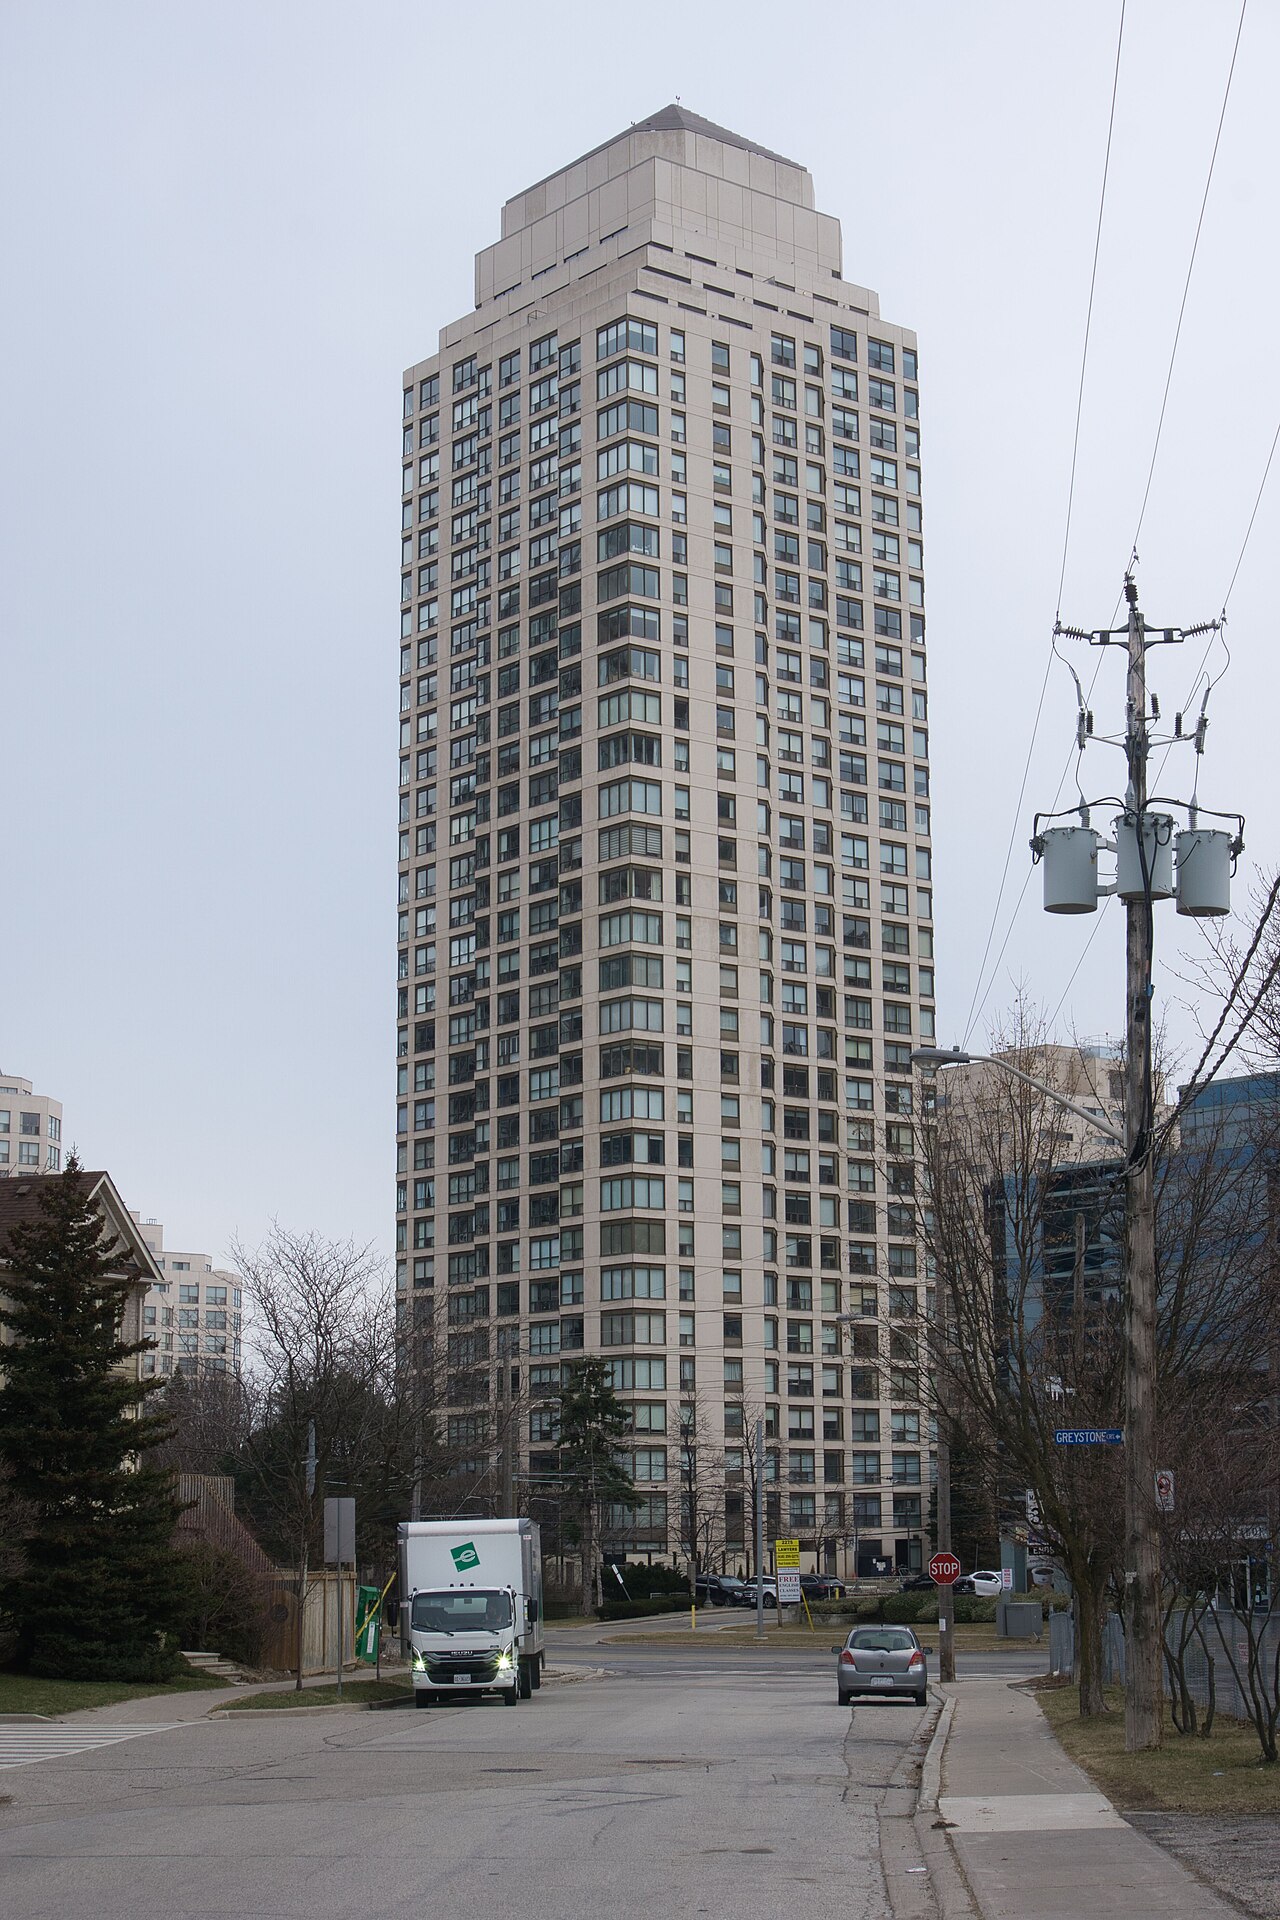
File photo: a residential high-rise on Lake Shore Boulevard West, Toronto (Chicken4War, CC BY-SA 4.0, Wikimedia Commons). The building is not named in the data.
Follow Canada News Media
Get the day's top Canadian stories and our two daily 60-second news videos wherever you scroll.
X Threads Facebook Instagram LinkedIn TikTok YouTube Pinterest Reddit Substack Flipboard Newsletter RSS