


Food purchased from stores cost 2.0% more in October 2026 than a year earlier (index 197.7 against 193.8), but our count of Statistics Canada’s consumer price index table finds 26 grocery lines that cost less, led by peppers (-9.1%), bacon (-8.1%), ham and bacon together (-7.0%) and oranges (-7.0%).
All seven major grocery groups rose: meat 3.1% (238.3 against 231.2), fish and seafood 3.9%, fruit and nuts 2.6%, other food products and non-alcoholic beverages 2.2%, vegetables 1.7%, dairy products and eggs 1.2% and bakery and cereal products 0.5%. Underneath, prices moved in both directions. Dry or fresh pasta fell 4.8% (131.6 against 138.3) and chicken drumsticks fell 4.8% (98.6 against 103.6), while chicken thighs rose 2.4% and whole chicken 3.8%. Fruit juices fell 4.6%, carrots 4.0%, ham excluding deli ham 2.6%, frozen fruit 2.5%, preserved fruit 1.7%, rice 1.6%, cheese 1.1%, potatoes 1.0%, eggs 0.7%, and soup, tea and roasted or ground coffee were each down 0.1% to 0.2%.
The 26 lines are not 26 separate baskets. Some sit inside broader ones (bacon inside ham and bacon, dry or fresh pasta inside pasta products, mozzarella inside cheese), and the table does not weight them equally. Beef went the other way: fresh or frozen beef was up 7.4%, and chuck cuts up 13.6%, which we covered in our look at beef since 2019. Statistics Canada’s own release says grocery inflation sped up from 1.7% in September because fresh vegetables rose 1.4% after falling 2.9%, and notes prices are 31.9% above October 2020.
The table shows what prices did, not why. Weather, import costs, promotions, supply and retailer decisions all affect individual items, and none is tested here. The index measures average prices across stores and brands, so it does not show that any particular store charged less, and no retailer or producer is accused of anything.
How we checked: We downloaded table 18-10-0004-01 (Consumer Price Index, monthly, not seasonally adjusted) on Nov. 16, 2026, took the Canada series for October 2025 and October 2026 for every product line, and computed each 12-month change as the October 2026 index divided by the October 2025 index minus one, so figures may differ by a tenth from Statistics Canada’s rounded percentages. We then kept the 26 food lines with a negative change (non-food lines such as footwear, appliances and phone plans were excluded). Some lines use different base years (for example 2013=100 or April 2024=100), which does not affect the percentage change. Source: Statistics Canada table 18-10-0004-01 and The Daily, Nov. 16, 2026. The November index is due Dec. 14.
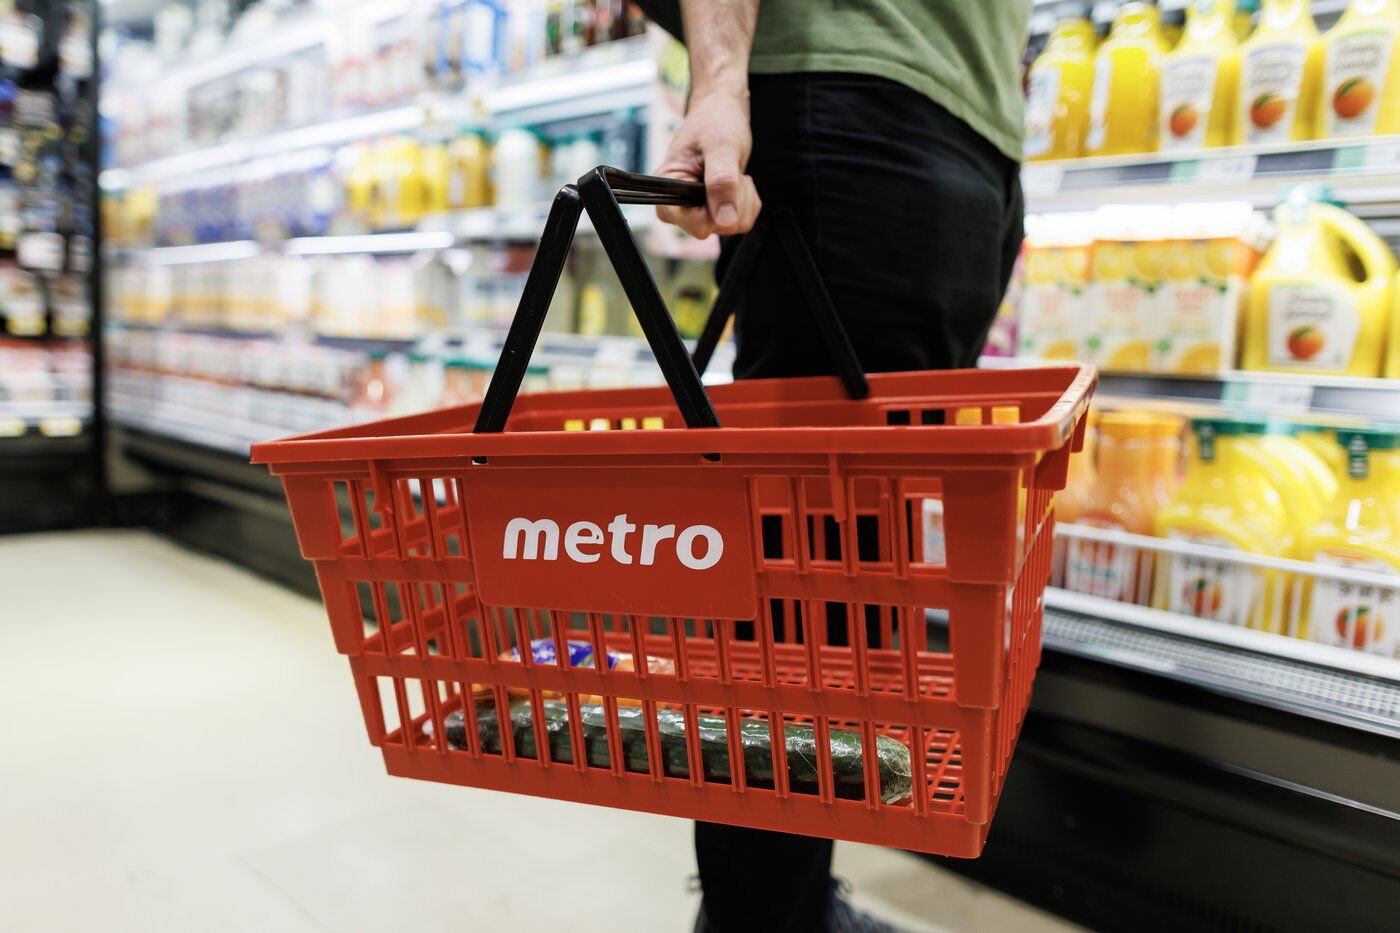
File photo: People shop inside a Metro grocery store in Toronto, July 18, 2023. THE CANADIAN PRESS/Cole Burston
Follow Canada News Media
Get the day's top Canadian stories and our two daily 60-second news videos wherever you scroll.
X Threads Facebook Instagram LinkedIn TikTok YouTube Pinterest Reddit Substack Flipboard Newsletter RSS