



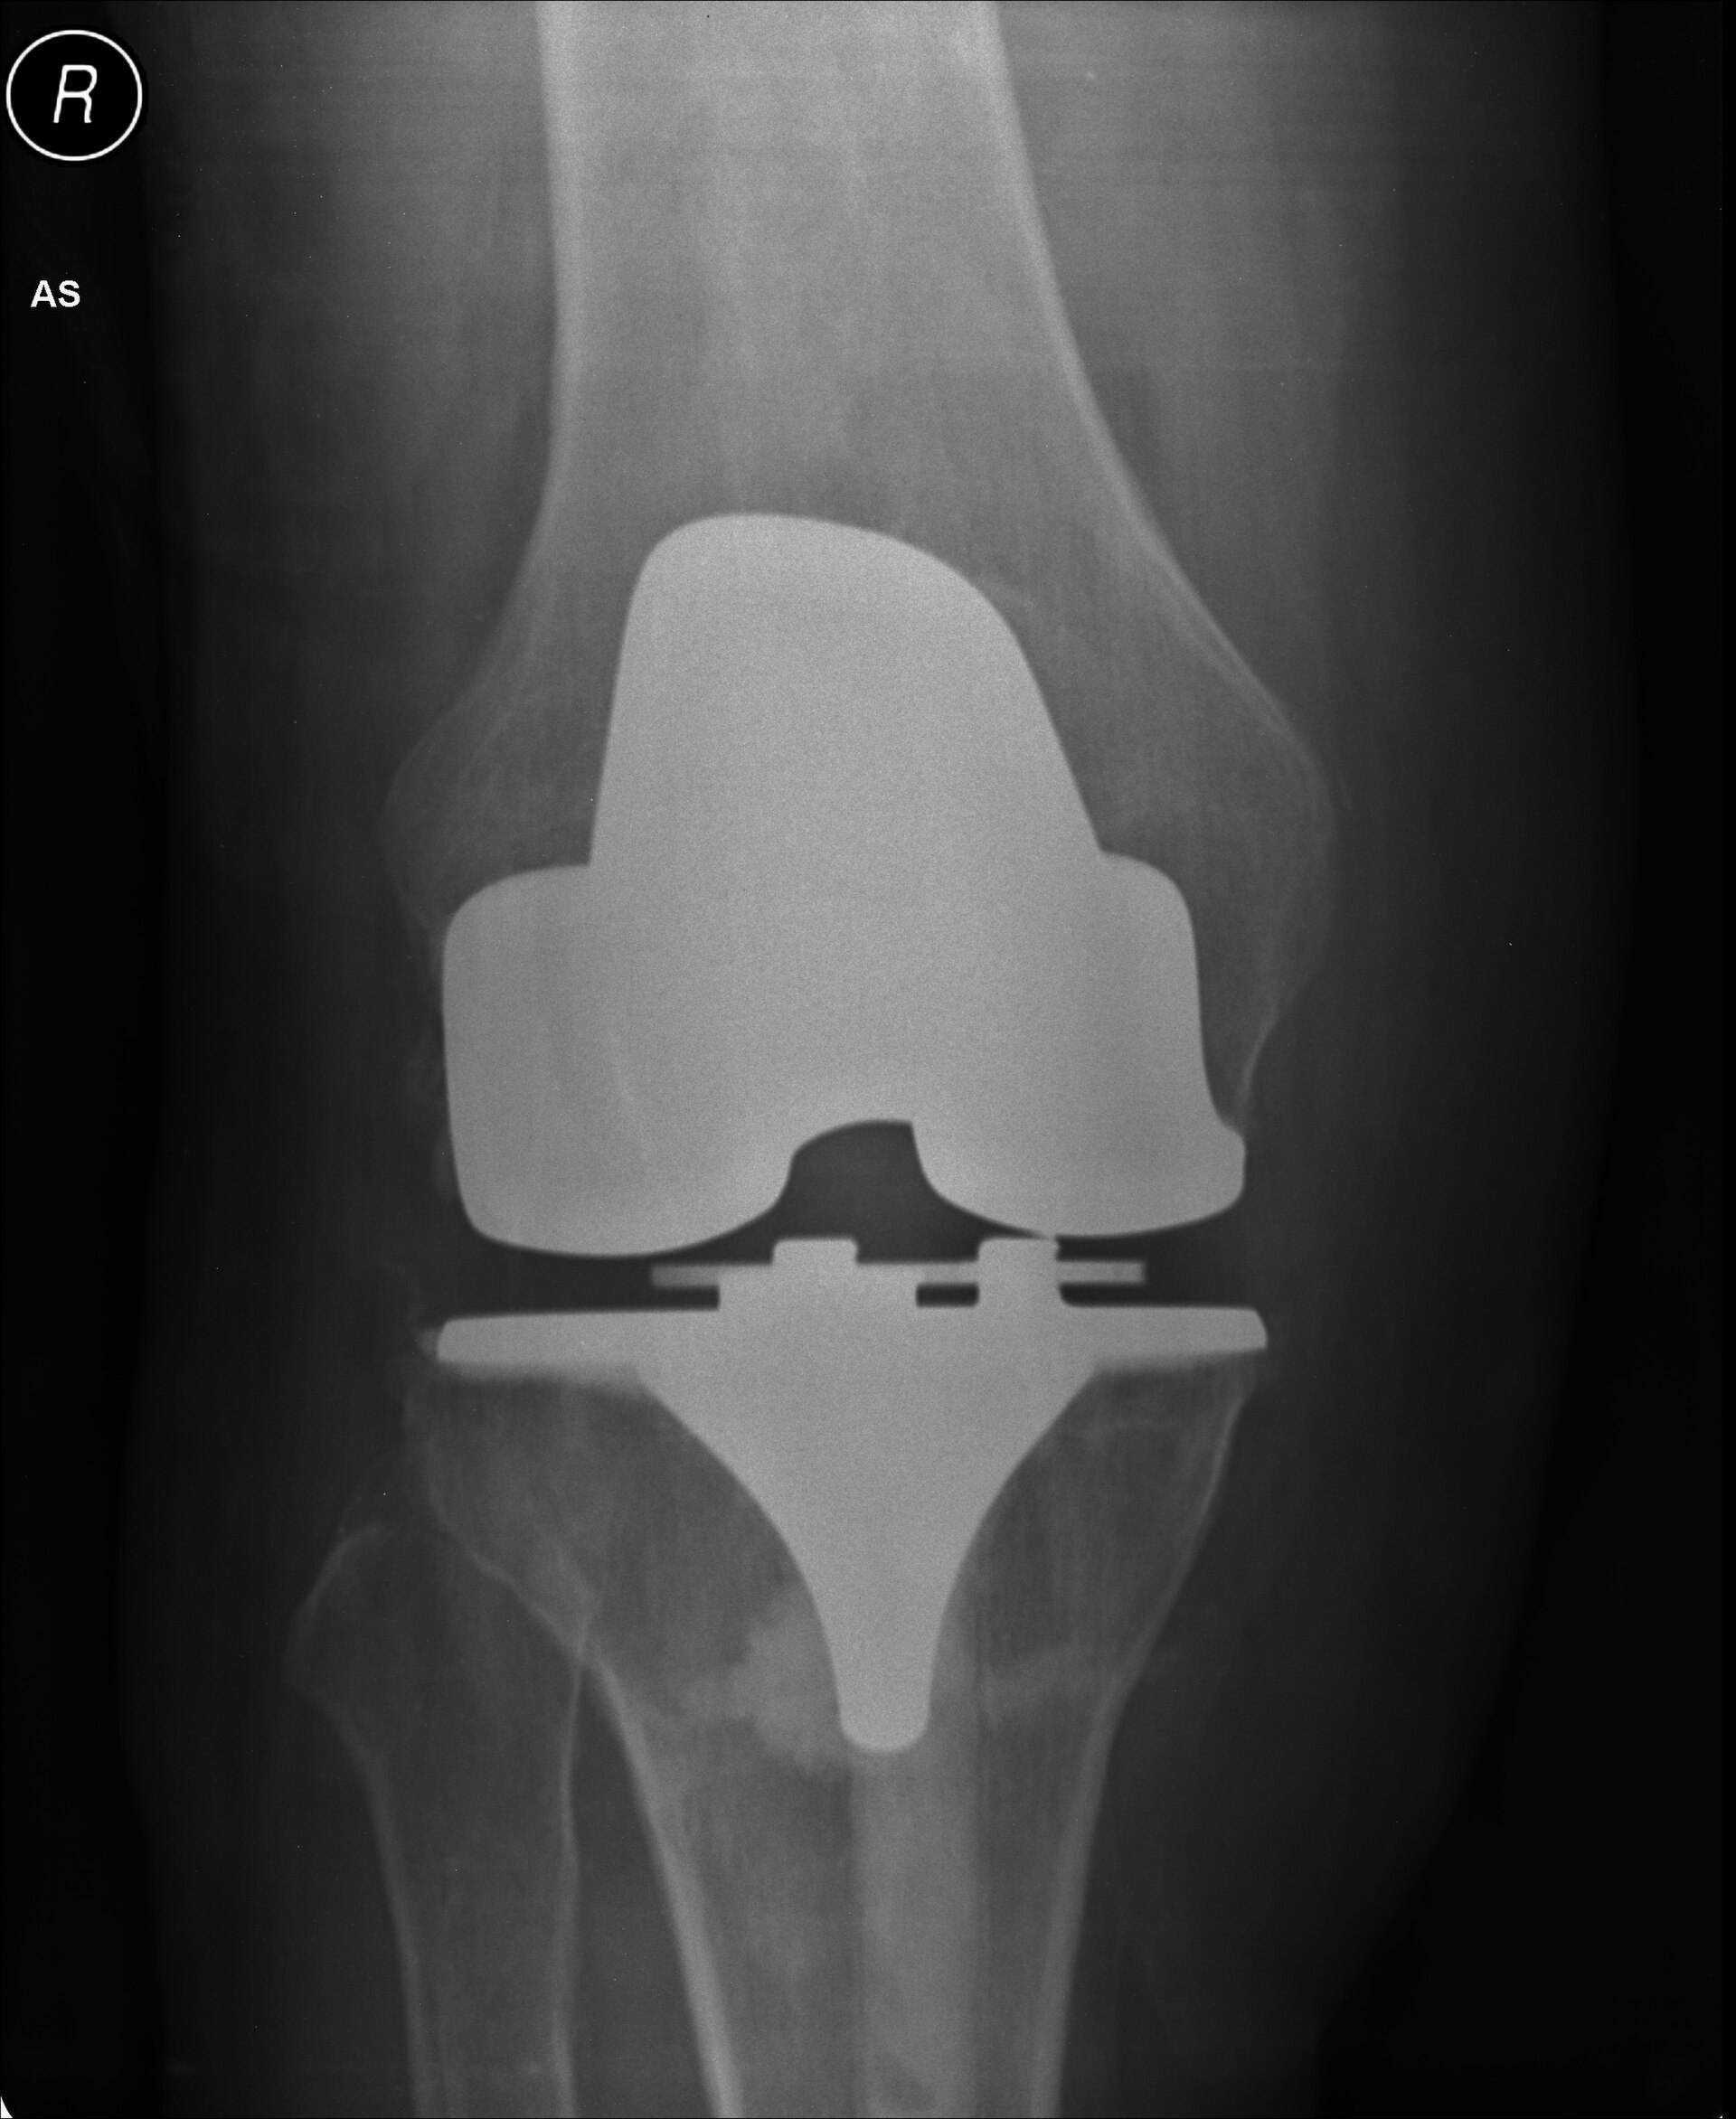
Canadian surgeons performed more knee replacements from April to September 2025 than in the same six months of any year in national records going back to 2010, yet a smaller share of patients got the operation within the 26-week national benchmark than before the pandemic, according to a Canada News Media analysis of Canadian Institute for Health Information data tables. In six of 10 provinces, the share treated on time was still below 2019.
Provinces reported 45,459 knee replacements for April to September 2025, up 29 per cent from 35,182 in the same months of 2019. Of those patients, 62.8 per cent were treated within 26 weeks, compared with 69.5 per cent in 2019, 76.6 per cent in 2015 and 79.6 per cent in 2010, the first year the national figure is available in the 2008 to 2025 tables. The median wait was 146 days, up from 121 in 2019, and one in 10 patients waited at least 361 days, up from 314.
Hip replacements show the same shape, slightly less pronounced. Volume rose to 28,463 from 21,941 in 2019, while the share meeting the benchmark was 69.2 per cent, down from 75.0 per cent in 2019 and 84.3 per cent in 2010. Cataract surgery, by contrast, is back to where it was: 69.7 per cent within its benchmark in 2025 against 70.4 per cent in 2019, on 208,731 procedures. CIHI’s own summary in its Wait times in Canada, 2026 release says joint replacement waits are “approaching pre-pandemic levels” and cataract waits have largely returned to them.
Our year-by-year pull of the national series shows the slide began before COVID-19. The share of knee patients treated within 26 weeks fell from 79.6 per cent in 2010 to 69.5 per cent in 2019, dropped to 47.1 per cent in 2020 and 50.3 per cent in 2022, and has climbed each year since, to 58.9, 61.4 and 62.8 per cent. For hips, it went from 84.3 per cent in 2010 to 75.0 per cent in 2019, 56.3 per cent in 2020 and 69.2 per cent in 2025. In other words, the recovery so far has brought the figures back toward a 2019 level that was itself well below the start of the decade.
The provincial picture is far apart. For knees, Ontario treated 82.1 per cent of patients within 26 weeks in 2025, with a median wait of 81 days, and Nova Scotia rose to 69 per cent from 47 per cent in 2019. Prince Edward Island was at 11.7 per cent, with a median of 424 days on 222 cases. Manitoba was at 31 per cent (median 286 days), Newfoundland and Labrador 37 per cent (median 298 days), Quebec 42 per cent (median 217 days, against 72.2 per cent and 118 days in 2019), Saskatchewan 42.8 per cent, New Brunswick 49 per cent, Alberta 52.5 per cent and British Columbia 57.2 per cent. The six provinces below their 2019 knee figure are British Columbia, Alberta, Manitoba, Quebec, Prince Edward Island and Newfoundland and Labrador; Saskatchewan, New Brunswick, Nova Scotia and Ontario are above it.
For hips, Ontario was at 83.8 per cent and Nova Scotia at 77 per cent, while Prince Edward Island was at 30.5 per cent, Manitoba 47 per cent, New Brunswick 51 per cent, Saskatchewan 51.8 per cent, Quebec 54 per cent, Newfoundland and Labrador 55 per cent, Alberta 63 per cent and British Columbia 64.1 per cent. Alberta’s knee figure fell 10 points in a year, from 62.5 per cent in 2024 to 52.5 per cent in 2025, even as its volume rose to 4,793 operations from 3,176 in 2019.
The numbers do not explain why. Rising demand from an aging population, how each province counts the start of a wait, the mix of public hospitals and contracted surgical centres, and the backlog left by cancelled surgeries in 2020 and 2021 can all push the share up or down, and the tables measure only patients who had surgery, not those still waiting. CIHI says provinces submit the hip, knee and cataract figures themselves, so definitions can differ, and its figures cover April to September of each year, which it considers representative of the full year. Our earlier reporting on Alberta’s two-tier health law and on the share of job vacancies in health care looks at other parts of the same system.
No province or health authority is accused here of anything; the figures are each province’s own submissions as CIHI published them. Patients waiting for a joint replacement can check their province’s wait-time website for current waits by surgeon or hospital.
How we checked: We downloaded CIHI’s Wait Times for Priority Procedures in Canada, 2008 to 2025 data tables (20,500 rows) from the priority procedures page and used the national and provincial rows for the percentage meeting benchmark, median, 90th percentile and volume of hip replacement, knee replacement and cataract surgery, using only the standard April to September data years and leaving out the extra pandemic-era periods. Percentages and days are rounded to one decimal place or the nearest day. CIHI’s context is in its methodology notes and the Wait times in Canada, 2026 release.
If you find reporting like this useful, consider supporting Canada News Media, an independently owned Canadian newsroom.
Follow Canada News Media
Get the day's top Canadian stories and our two daily 60-second news videos wherever you scroll.
X Threads Facebook Instagram LinkedIn TikTok YouTube Pinterest Reddit Substack Flipboard Newsletter RSS