


Real estate and rental firms now hold 22.8% of all business credit outstanding in Canada, up from 19.5% in 2011, while manufacturers’ share has fallen from 9.4% to 7.2% and their borrowing has not grown in three years, our analysis of Statistics Canada lending data shows.
In January 2026, lenders reported $1.447 trillion in business credit outstanding. Of that, $329.9 billion was owed by real estate and rental and leasing businesses, a category that includes landlords and property companies. That is up 244% from $95.8 billion in January 2011, against 194% growth for all business credit. Among the named industries, real estate also took the largest share of new borrowing lately: of the $165.6 billion added since January 2023, $42.0 billion, or 25.3%, went to the sector. Manufacturing owed $104.5 billion, which is 7.2% of the total, down from $46.1 billion and 9.4% in 2011.
Manufacturing’s balance was $104.3 billion in January 2023 and $104.5 billion in January 2026, a rise of 0.2% while total business credit grew 12.9%. Consumer prices rose about 7.2% over those three years (all-items index 153.9 to 165.0), so manufacturers’ outstanding credit shrank by roughly 7% after inflation. The mix of lenders changed too. Domestic banks increased their manufacturing credit 7.8%, to $64.8 billion, but the “other banks” category cut its balance by 41.6%, from $17.1 billion to $10.0 billion.
Two other industries stand out for losing ground. Professional, scientific and technical services owed $38.1 billion in January 2026, down 4.8% from $40.0 billion three years earlier, and up only 12.7% since 2019, while total business credit rose 51.1%. Transportation and warehousing owed $60.9 billion, down 13.3% from $70.3 billion in January 2023, even as the number of accounts rose from 154,946 to 168,949. Almost all of that decline arrived in a single reporting period: the balance was $70.7 billion in January 2024 and $57.6 billion in July 2024, an 18.5% drop in six months, and domestic banks’ balance fell from $48.7 billion to $39.2 billion over the three years. Statistics Canada warns that figures can move with mergers, industry reclassifications and methodology changes, and a one-period step of that size could reflect one of those rather than lenders pulling back from trucking, airlines and warehouses, so we cannot say which. It does come as transportation firms’ insolvencies run at double their pre-pandemic pace.
The table covers businesses of all sizes, so it cannot show whether small firms in any industry were refused credit. It measures balances owed, not applications, approvals or interest rates, and a rising share can reflect strong demand, rising property values or lenders’ preference for assets they can secure as easily as it can reflect a lack of access elsewhere. Real estate borrowing also includes large institutional landlords. No lender is accused of anything, and the data do not say why credit moved the way it did.
The pattern adds to other records we have published on who gets money in Canada’s economy. As we reported, loans of the size small businesses use have fallen below 10% of business credit, and uninsured loans are now three-quarters of bank mortgages. This story is part of our series on competition and small business in Canada.
How we checked: We downloaded Statistics Canada table 33-10-0014-01, “Business credit outstanding, by supplier type and industry”, from the Biannual Survey of Suppliers of Business Financing, with semi-annual data from January 2011 to January 2026. We used the “all suppliers” value of credit outstanding by industry and divided each industry by the all-industries total; for January 2026, $329,865 million ÷ $1,447,129 million = 22.8%. Changes since January 2023 compare that period with January 2026, and supplier-type figures use the same table. Inflation uses the all-items consumer price index from table 18-10-0004-01. Industry names follow the North American Industry Classification System as Statistics Canada groups them. Figures are subject to revision.
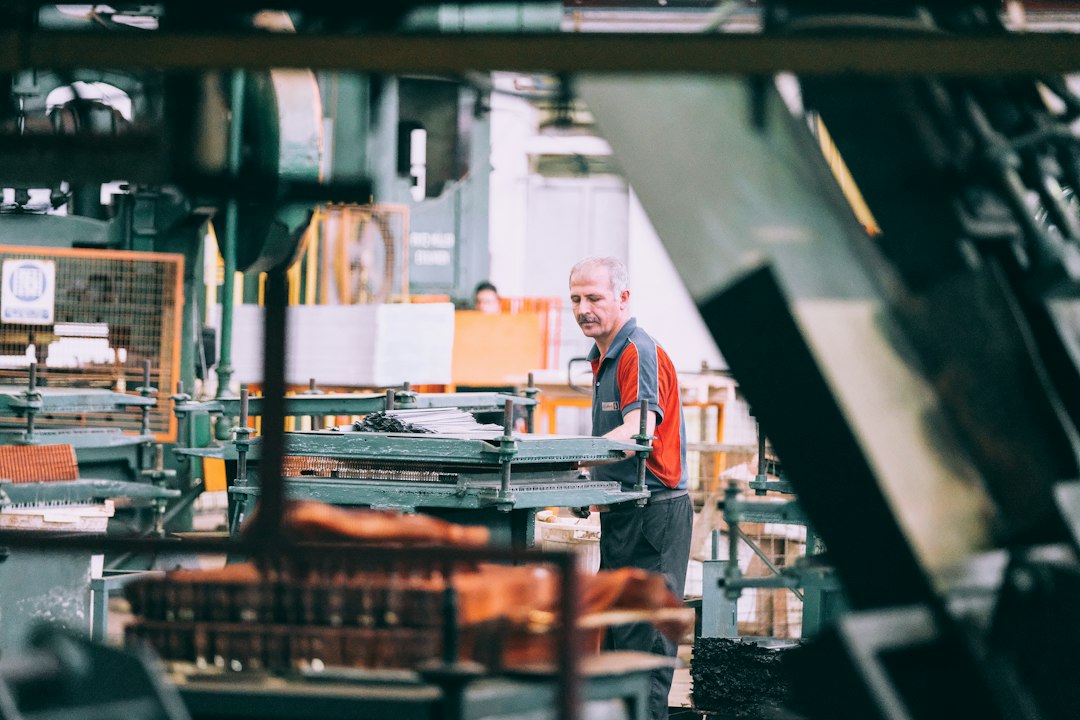
File photo: a worker on a manufacturing floor. The plant and worker shown are not connected to the figures in this story.
Follow Canada News Media
Get the day's top Canadian stories and our two daily 60-second news videos wherever you scroll.
X Threads Facebook Instagram LinkedIn TikTok YouTube Pinterest Reddit Substack Flipboard Newsletter RSS