



A full-time minimum-wage worker would have to spend more than 30 per cent of before-tax pay to rent an average one-bedroom apartment in 41 of 43 Canadian cities and metropolitan areas, a Canada News Media analysis of federal rent data and current minimum wages found.
Thirty per cent is the line used by Canada Mortgage and Housing Corporation, which says housing is considered affordable if it costs less than 30 per cent of a household’s before-tax income. Only Saguenay and Trois-Rivières, both in Quebec, came in under it. For a two-bedroom apartment, no area did.
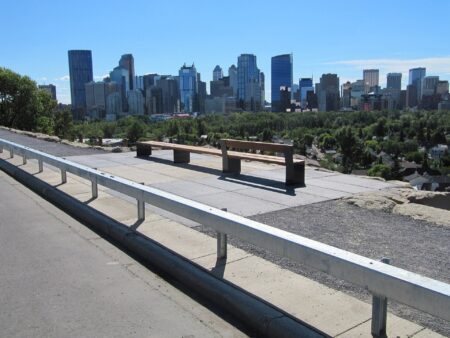
The squeeze is tightest in Calgary, not Vancouver or Toronto. The average one-bedroom in Calgary rents for $1,581 a month, or 61 per cent of the before-tax pay of someone working 40 hours a week at Alberta’s $15 minimum wage. To keep that rent at 30 per cent of pay, the same worker would need 81 hours of work a week, or a wage of about $30.40 an hour at 40 hours.
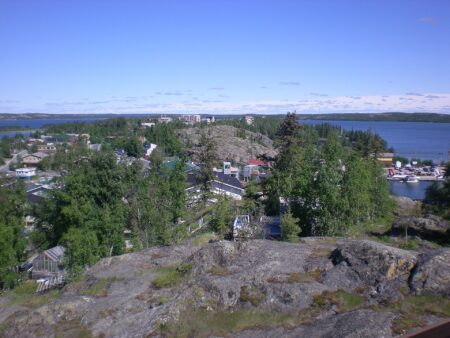
Vancouver has the highest one-bedroom rent in the comparison at $1,807, which is $226 more than Calgary. But B.C.’s minimum wage is $18.25, so that rent takes 57 per cent of full-time minimum-wage pay. Toronto is also at 57 per cent, and Yellowknife is at 59 per cent.
Alberta’s wage has not moved since 2018
Alberta’s general minimum wage is $15 an hour. It has been at that level since October 2018, and it is now the lowest of any province or territory, according to our guide to minimum wages by province. That is why all four Alberta areas in the comparison rank higher on this measure than their rents alone would suggest. Edmonton’s average one-bedroom, at $1,301, is $280 cheaper than Calgary’s, yet it still takes 50 per cent of full-time minimum-wage pay. Lethbridge is at 53 per cent and Red Deer is at 47 per cent.
At $15 an hour and 40 hours a week, a worker earns $31,200 a year before taxes. Thirty per cent of that is $780 a month, which is $521 below Edmonton’s average one-bedroom rent and $801 below Calgary’s. Employers can pay more than the minimum, so these figures show the legal floor and not typical pay.
Rents rose in 40 of the 43 areas
The average one-bedroom rent rose in 40 of the 43 areas from 2024 to 2025. It fell only in Calgary (down $3), Hamilton (down $11) and Oshawa (down $11). Halifax had one of the biggest increases among large cities, up $137 to $1,539. These are changes in overall averages, not the rent on the same apartments from one year to the next.
Two-bedroom apartments, the size many families need, are further out of reach. Vancouver’s average of $2,364 would take nearly 100 hours a week at minimum wage to stay at 30 per cent of pay, and Calgary’s average of $1,908 would take about 98 hours. Even in Saguenay, the lowest-rent area in the comparison, a $986 two-bedroom would take about 46 hours.
The full comparison
Areas are ranked by the hours of minimum-wage work a week needed to keep the average one-bedroom rent at 30 per cent of before-tax pay.
| Area | Minimum wage | Average one-bedroom rent | Share of full-time minimum-wage pay | Hours a week to stay at 30% |
|---|---|---|---|---|
| Calgary, Alta. | $15.00 | $1,581 | 61% | 81 |
| Yellowknife, N.W.T. | $17.20 | $1,757 | 59% | 79 |
| Vancouver, B.C. | $18.25 | $1,807 | 57% | 76 |
| Toronto, Ont. | $17.95 | $1,761 | 57% | 75 |
| Lethbridge, Alta. | $15.00 | $1,370 | 53% | 70 |
| Guelph, Ont. | $17.95 | $1,627 | 52% | 70 |
| Halifax, N.S. | $17.00 | $1,539 | 52% | 70 |
| Victoria, B.C. | $18.25 | $1,624 | 51% | 68 |
| Ottawa (Ontario side) | $17.95 | $1,593 | 51% | 68 |
| Oshawa, Ont. | $17.95 | $1,586 | 51% | 68 |
| Barrie, Ont. | $17.95 | $1,583 | 51% | 68 |
| Kelowna, B.C. | $18.25 | $1,597 | 50% | 67 |
| Edmonton, Alta. | $15.00 | $1,301 | 50% | 67 |
| Kitchener-Cambridge-Waterloo, Ont. | $17.95 | $1,546 | 50% | 66 |
| Kingston, Ont. | $17.95 | $1,503 | 48% | 64 |
| Nanaimo, B.C. | $18.25 | $1,527 | 48% | 64 |
| Gatineau (Quebec side) | $16.60 | $1,362 | 47% | 63 |
| Saskatoon, Sask. | $15.70 | $1,281 | 47% | 63 |
| Red Deer, Alta. | $15.00 | $1,220 | 47% | 63 |
| Brantford, Ont. | $17.95 | $1,448 | 47% | 62 |
| Regina, Sask. | $15.70 | $1,240 | 46% | 61 |
| Hamilton, Ont. | $17.95 | $1,402 | 45% | 60 |
| London, Ont. | $17.95 | $1,371 | 44% | 59 |
| Fredericton, N.B. | $15.90 | $1,208 | 44% | 58 |
| Winnipeg, Man. | $16.40 | $1,232 | 43% | 58 |
| Kamloops, B.C. | $18.25 | $1,345 | 43% | 57 |
| St. Catharines-Niagara, Ont. | $17.95 | $1,318 | 42% | 56 |
| Moncton, N.B. | $15.90 | $1,164 | 42% | 56 |
| Abbotsford-Mission, B.C. | $18.25 | $1,278 | 40% | 54 |
| Greater Sudbury, Ont. | $17.95 | $1,244 | 40% | 53 |
| Peterborough, Ont. | $17.95 | $1,232 | 40% | 53 |
| Montréal, Que. | $16.60 | $1,131 | 39% | 52 |
| Chilliwack, B.C. | $18.25 | $1,222 | 39% | 52 |
| Québec, Que. | $16.60 | $1,107 | 38% | 51 |
| Windsor, Ont. | $17.95 | $1,193 | 38% | 51 |
| Thunder Bay, Ont. | $17.95 | $1,173 | 38% | 50 |
| St. John’s, N.L. | $16.35 | $1,064 | 38% | 50 |
| Saint John, N.B. | $15.90 | $1,001 | 36% | 48 |
| Charlottetown, P.E.I. | $17.30 | $1,066 | 36% | 47 |
| Sherbrooke, Que. | $16.60 | $905 | 31% | 42 |
| Drummondville, Que. | $16.60 | $904 | 31% | 42 |
| Trois-Rivières, Que. | $16.60 | $828 | 29% | 38 |
| Saguenay, Que. | $16.60 | $762 | 26% | 35 |
How we did this, and what it does not show
Rents are the 2025 averages for apartments in row and apartment buildings of three or more units, from the Canada Mortgage and Housing Corporation figures in Statistics Canada table 34-10-0133-01. They come from CMHC’s Rental Market Survey, and the 2026 results are not out yet. Minimum wages are the general adult rates in effect on Nov. 4, 2026, as listed in our guide, which links each government’s source.
We compared rents with pay for 40 hours a week over 52 weeks, before taxes. The hours column divides the yearly pay needed to keep the rent at 30 per cent by 52 weeks and by the hourly minimum wage. The comparison covers all census metropolitan areas with a 2025 one-bedroom figure, plus Charlottetown and Yellowknife. We split Ottawa-Gatineau because each side has a different minimum wage. Belleville-Quinte West and Whitehorse have no 2025 one-bedroom figure in the table, and Nunavut is not included.
The comparison has limits. The rent data is older than the wage data, and rents may have changed since. These are averages for all tenants in purpose-built rentals, including people who have lived in their apartments for years, so someone moving now can face a different price. The survey leaves out rented condos and basement suites. Many minimum-wage workers share housing or work fewer than 40 hours, and some have other income. The analysis measures the gap between the legal wage floor and average rents. It makes no finding about any landlord or employer, and it did not rely on any government’s comment. If you have information or a response, write to [email protected].
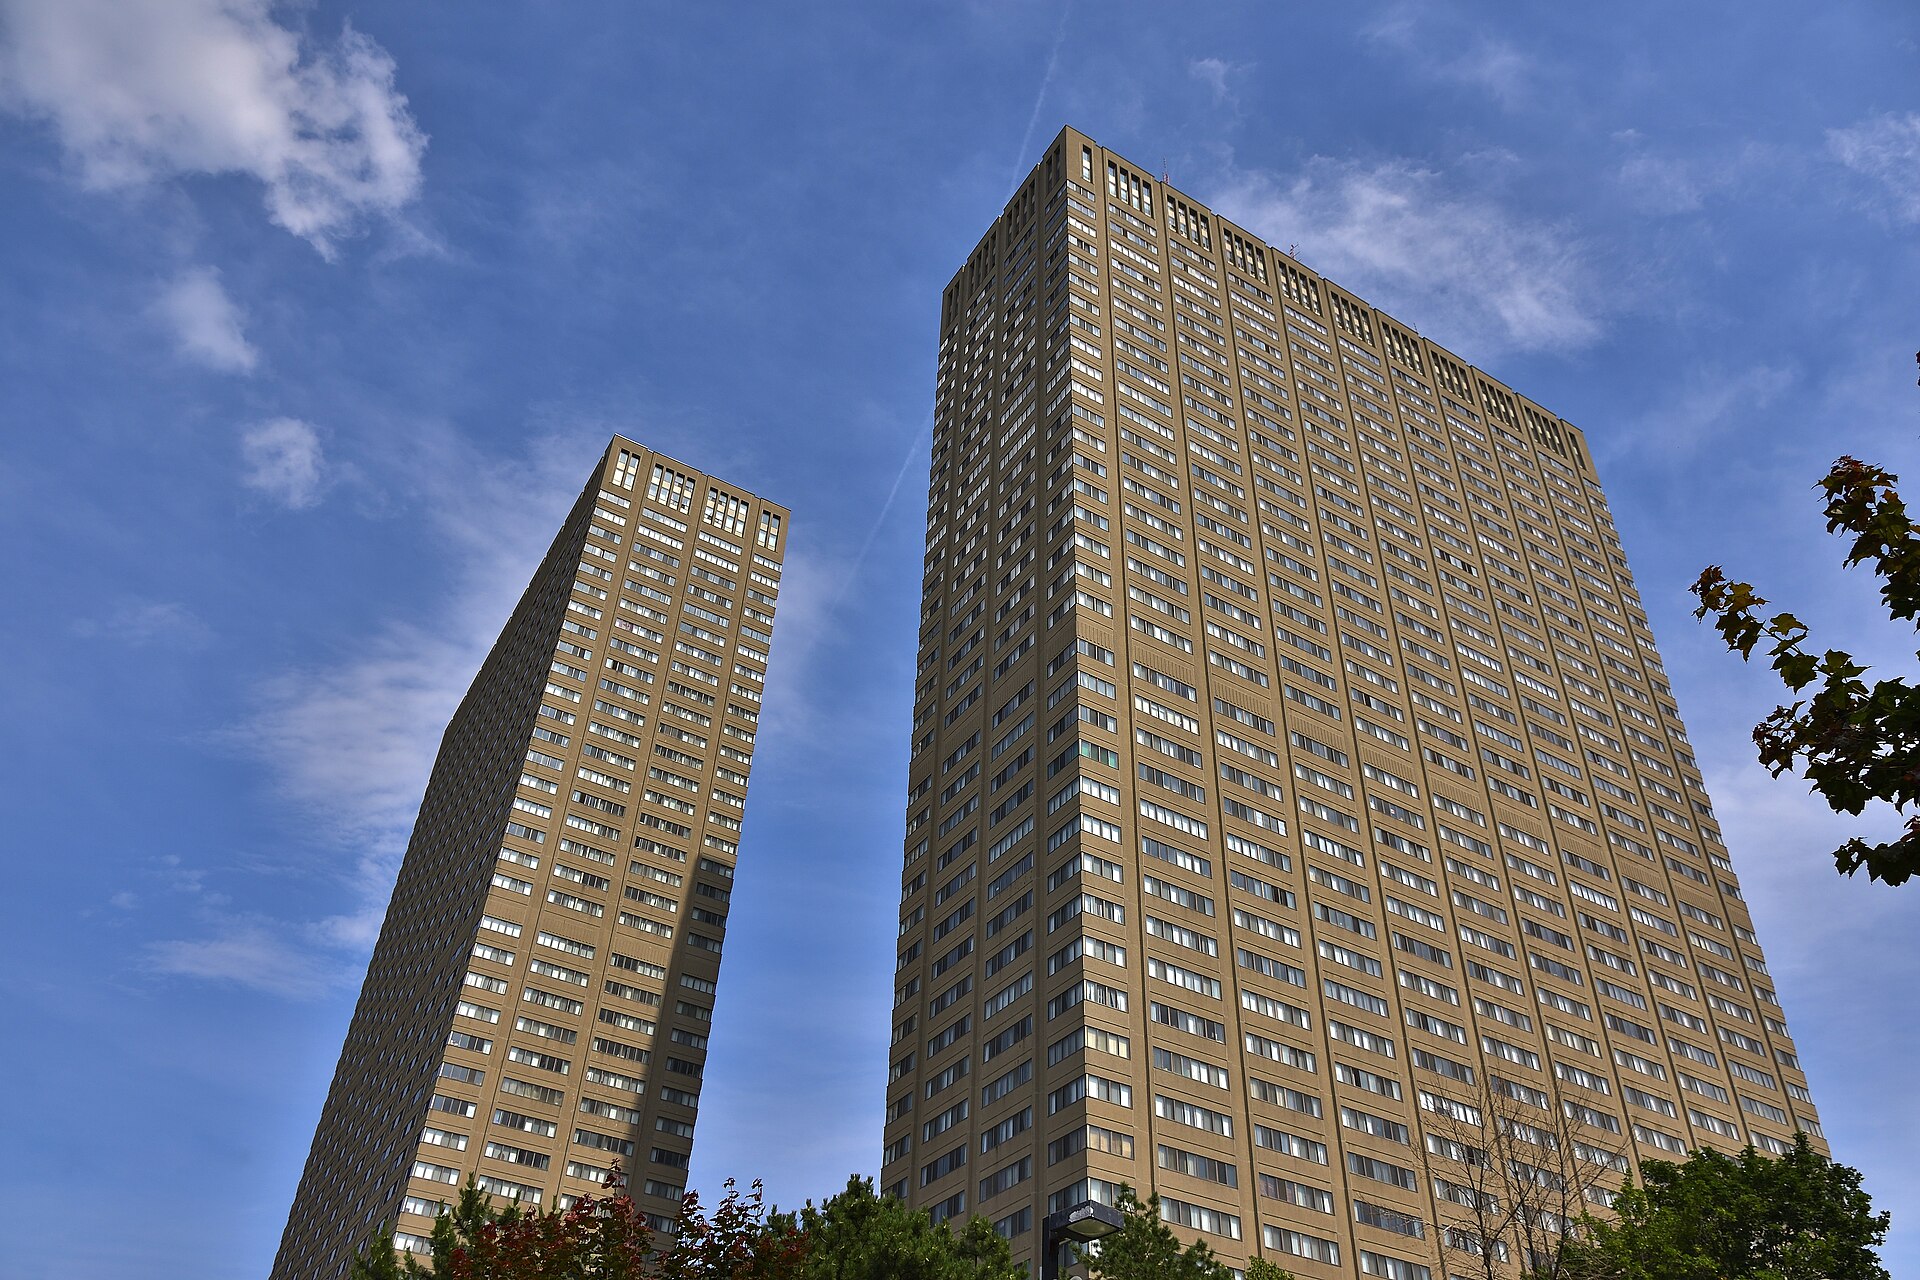
Photo: file photo of apartment towers in Toronto’s Thorncliffe Park, not a specific building in this data. Taken July 7, 2017, by SAF1999, via Wikimedia Commons (CC BY-SA 4.0).
If you find reporting like this useful, consider supporting Canada News Media, an independent Canadian newsroom with no corporate parent.
Follow Canada News Media
Get the day's top Canadian stories and our two daily 60-second news videos wherever you scroll.
X Threads Facebook Instagram LinkedIn TikTok YouTube Pinterest Reddit Substack Flipboard Newsletter RSS