

Canada’s census metropolitan areas had 7,568 newly built single-detached and semi-detached homes finished and unsold at the end of October, up 14.3 per cent from 6,621 a year earlier and the highest count for any October since 1990, according to our analysis of Statistics Canada data. Over the same month, 2,831 of these homes sold, down 11.4 per cent from 3,195 in October 2025.
The figures come from Statistics Canada table 34-10-0149-01, which carries Canada Mortgage and Housing Corporation’s monthly Market Absorption Survey back to June 1988. “Unabsorbed inventory” means newly completed homes that have not been sold; “absorptions” are the homes that sold in the month. The table covers only single-detached and semi-detached homes, so condominiums, row houses and apartments are not in it. In the October series, only 1990 (8,831) was higher than this year’s 7,568; the next highest were 2019 (7,389) and 2008 (7,183). The total was higher in some months earlier this year, peaking at 7,830 in April.
Put against sales, the stock has grown. By our own simple calculation, which is not a CMHC measure, October’s unsold homes equal about 2.7 months of that month’s sales, up from about 2.1 months a year earlier.
The national total hides a split. Of the 33 metropolitan areas with figures in both Octobers, 20 had more unsold homes than a year earlier, 12 had fewer and one was unchanged. Alberta drove much of the rise: Calgary had 1,567, up 65.5 per cent from 947, and Edmonton had 1,720, up 3.2 per cent from 1,667, together about 43 per cent of the national total. Saskatoon (146 to 263) and Regina (31 to 103) also climbed. We have reported on Calgary’s record count and on Regina and Saskatoon.
The country’s two biggest cities moved up more modestly. Toronto had 545, up 11.9 per cent from 487, and Vancouver had 872, up 7.1 per cent from 814. In the Atlantic provinces, Halifax went from 75 to 106 (up 41.3 per cent), Moncton from 47 to 54 and Saint John from 4 to 12, all small counts. St. Catharines-Niagara rose from 158 to 184 and Victoria from 83 to 112.
Others went the other way. Winnipeg fell from 250 to 211, London from 367 to 327, Windsor from 77 to 37 and Sherbrooke from 58 to 28. Montreal was nearly flat at 245 against 242, and Ottawa-Gatineau fell from 204 to 183.
The records do not say why the national count rose, and we do not claim a cause. The table does not report asking prices, builder incentives, mortgage conditions or how many homes have been discounted, and small monthly counts can swing quickly. For a household shopping for a new house, the practical point is narrow: more finished homes waiting for buyers means more choice in the new-home market, but this table cannot show whether prices are being cut.
How we checked: We downloaded Statistics Canada table 34-10-0149-01 on Nov. 20, 2026 (table page) and read the “Unabsorbed inventory” and “Absorptions” series for “Total units” for the “Census metropolitan areas” total and for each listed metropolitan area from June 1988 to October 2026. We compared October 2026 with October 2025 for each area that had a figure in both months (33 areas, counting Ottawa-Gatineau once), and compared the national October totals from 1988 to 2026. The months-of-sales figure divides October’s unsold stock by October’s sales and is our own calculation. We searched our own site for earlier stories on national unsold new homes in the last 12 months and found only our Calgary and Regina and Saskatoon stories linked above. No builder, city or agency is accused of anything, so no right of reply was sought.
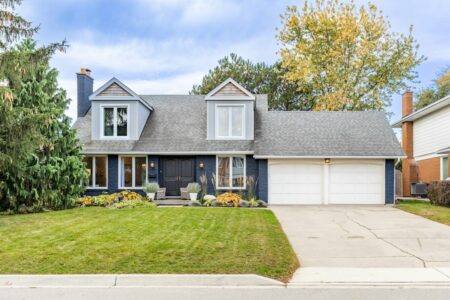
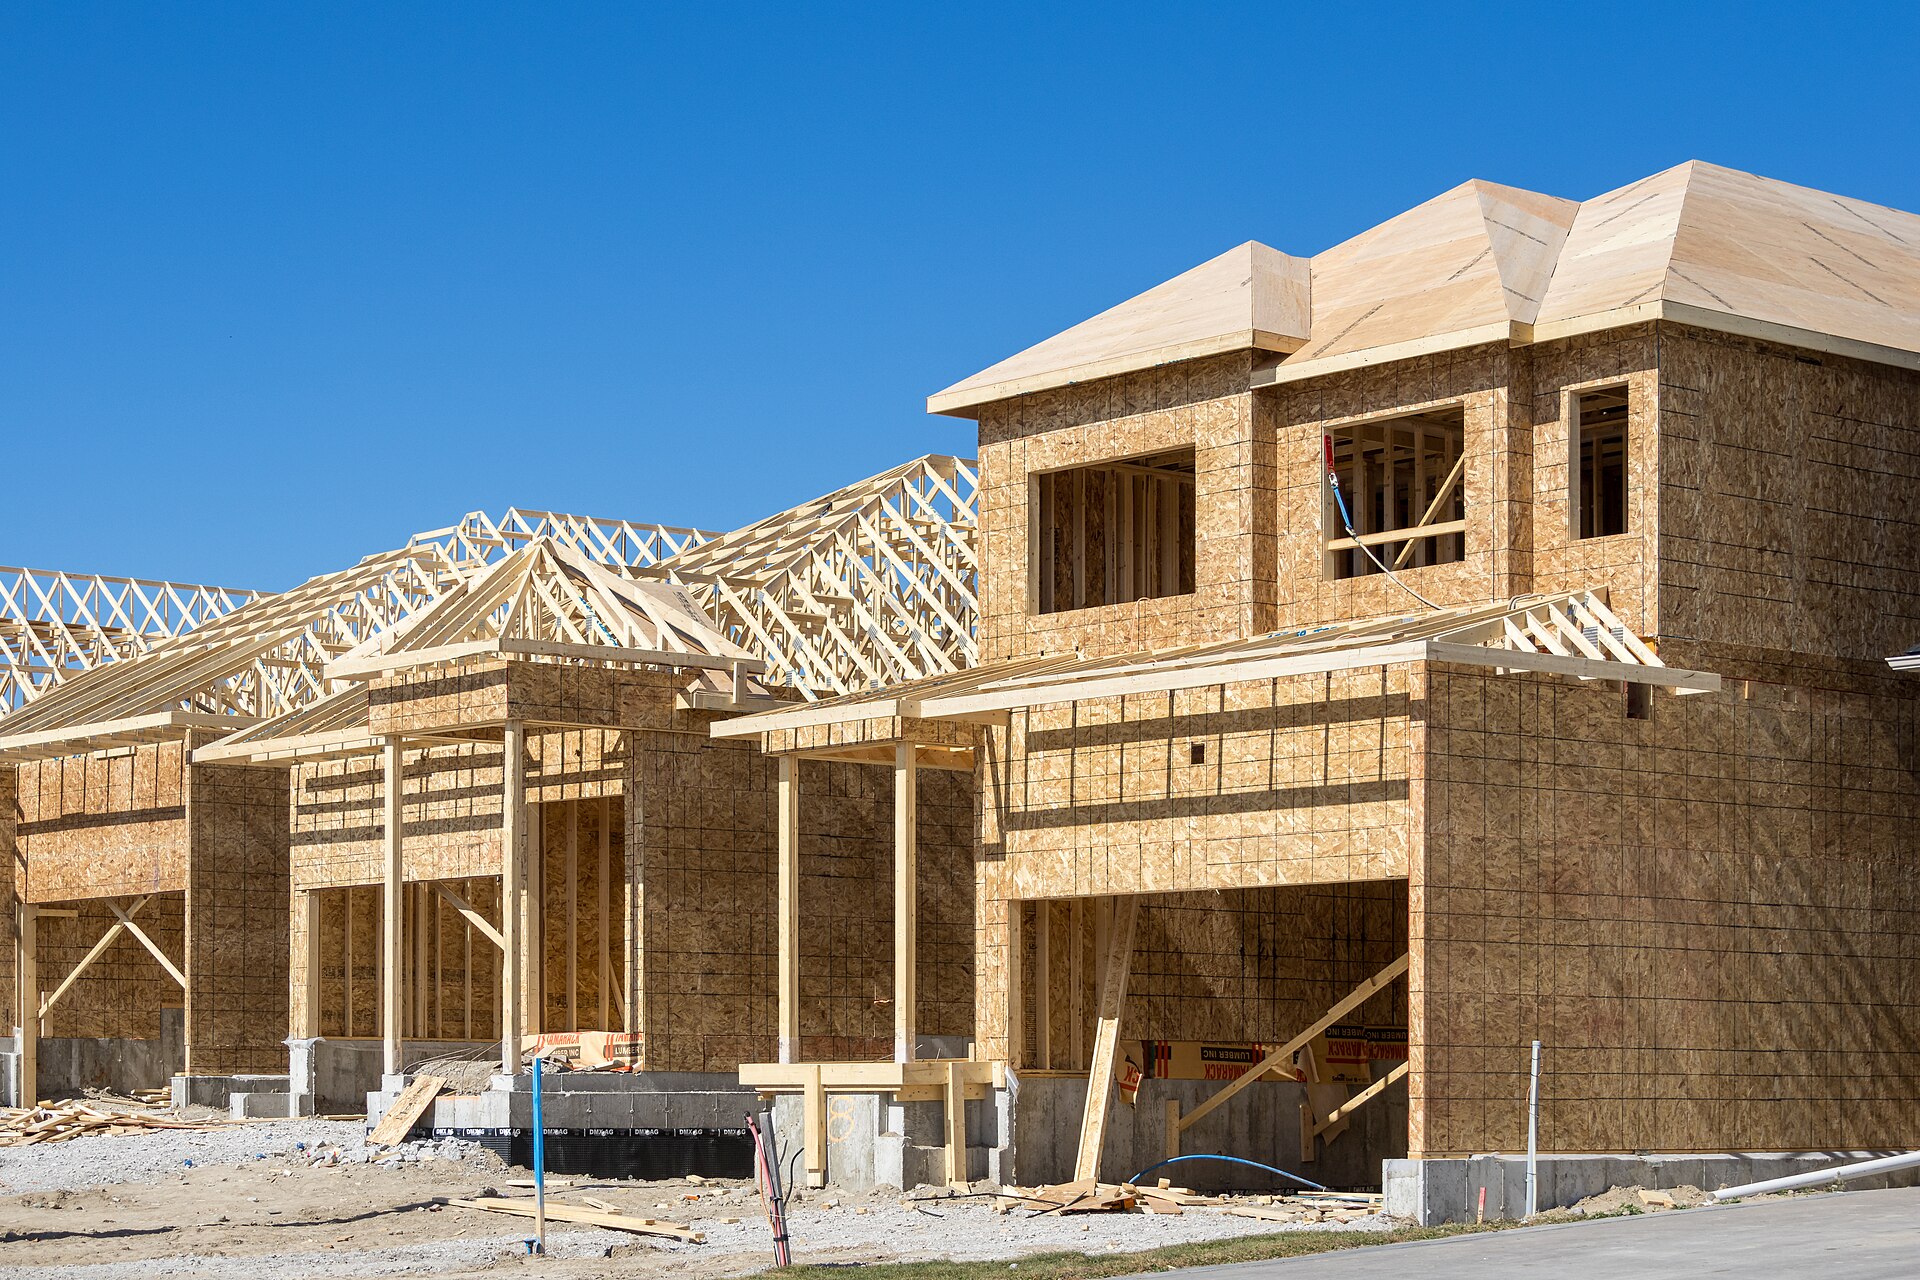
File photo: new homes under construction in Bowmanville, Ont. Photo by Dillan Payne via Wikimedia Commons, CC BY-SA 4.0.
Follow Canada News Media
Get the day's top Canadian stories and our two daily 60-second news videos wherever you scroll.
X Threads Facebook Instagram LinkedIn TikTok YouTube Pinterest Reddit Substack Flipboard Newsletter RSS