


Electricity prices in Whitehorse have risen 74.0% since October 2019, more than in any of the 10 provinces or the other territorial city Statistics Canada tracks, according to the agency’s consumer price index. The Whitehorse electricity index stood at 246.6 (2002=100) in October 2026, up from 141.7 in October 2019. Canada’s electricity index rose 21.9% over the same seven years, from 146.3 to 178.4, and Whitehorse’s all-items index rose 29.1%.
Alberta was next at 44.7% (149.8 to 216.8), ahead of Prince Edward Island (30.0%), New Brunswick (28.4%) and Nova Scotia (28.0%). Newfoundland and Labrador rose 25.1%, Ontario 23.5%, British Columbia 16.6%, Quebec 16.3%, Manitoba 14.0% and Saskatchewan 12.7%. Yellowknife rose 18.6% (202.4 to 240.0). Index levels cannot be compared between places, because each starts from its own 2002 base, so the comparison here is of changes, not of what households pay.
In Whitehorse the October-to-October change was 7.2% this year (230.0 to 246.6), after yearly changes of 21.2% in 2020, 2.6% in 2021, a 0.9% fall in 2022, 7.2% in 2023, 14.1% in 2024 and 7.7% in 2025. The index does not move smoothly. It is published as the same number for each three-month stretch, then steps. In 2025 it read 209.5 from January to March, 235.5 from April to June, 261.3 from July to September and 230.0 from October to December. In 2026 it read 227.9 from January to March, 304.9 from April to June, 308.6 from July to September and 246.6 in October. At its July-September 2026 reading the index was 117.8% above October 2019.
The Statistics Canada table does not say what drove those steps. They could reflect rate changes, rebates or credits that start or end, or how the agency prices the service, and the table gives no breakdown. We did not find the cause in the records we read, so this story does not state one. Yukon’s projected power-bill pressures were the subject of our earlier report, which dealt with forecasts rather than this price history.
For households, the index is an average for the city. What a bill actually does depends on the customer class, the amount used and any rebate that applies, and the utility and the Yukon Utilities Board publish current rate schedules.
How we checked: We downloaded Statistics Canada’s table 18-10-0004-01 (consumer price index, monthly, not seasonally adjusted, data to October 2026) and took the “Electricity” component for Whitehorse, Yellowknife, each province and Canada, plus all items for Whitehorse. We calculated each percentage change from the published index values. No organization is accused of anything in this story, so none was asked for comment.
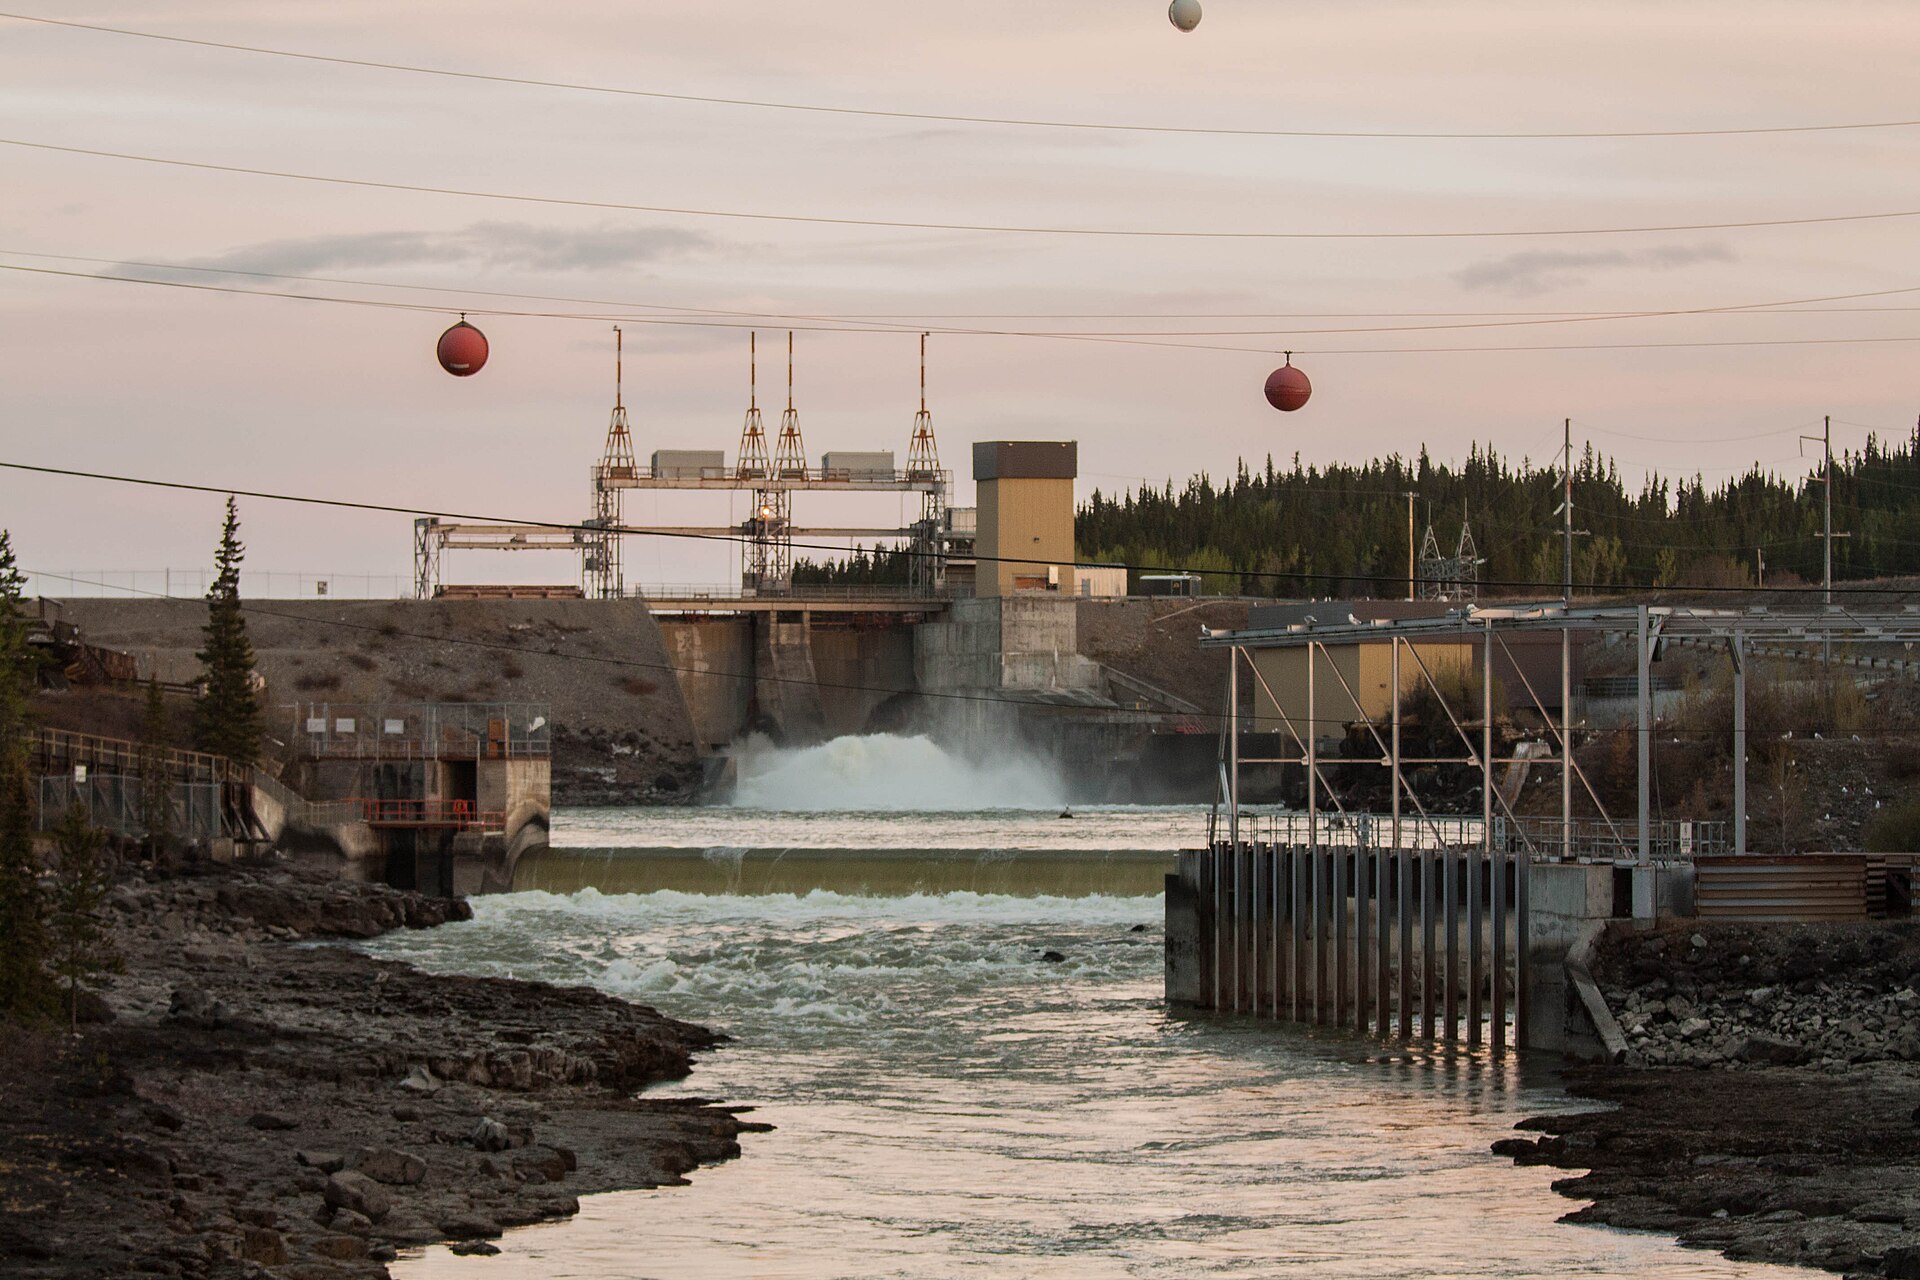
File photo: the Whitehorse Rapids Dam on the Yukon River. Photo: Maciej, 2014, CC BY-SA 2.0, via Wikimedia Commons.
Follow Canada News Media
Get the day's top Canadian stories and our two daily 60-second news videos wherever you scroll.
X Threads Facebook Instagram LinkedIn TikTok YouTube Pinterest Reddit Substack Flipboard Newsletter RSS