
Courts in Canada are putting businesses into receivership at the fastest pace on record, and British Columbia has gone from a handful of cases a year to more than a hundred, our count of federal insolvency records shows.
From January to September 2026, courts appointed receivers in 574 cases across the country, according to the monthly receivership statistics kept by the Office of the Superintendent of Bankruptcy. That is up 6.5% from 539 in the same months of 2025, nearly triple the 224 of 2023, and two and a half times the 228 of 2019. It is the highest January-to-September total since the series begins in December 1992. The full year 2025 already set a record, with 738 court-appointed receiverships, ahead of 570 in 2024. Before 2024, no year had more than 410.
A receivership is one of the main ways a secured lender, usually a bank or private lender holding a mortgage or a charge on a company’s assets, takes control when a borrower cannot pay. A receiver is put in charge of the property, often to sell it and repay the secured creditor. The receiver can be named by a court or appointed privately under the loan agreement, and the two have moved in opposite directions: private appointments fell to 90 in the first nine months of this year, down from 1,312 in the same months of 1993. Counting both kinds, the 664 receiverships so far in 2026 are the most for those months since 2002.
The assets involved are large. Businesses placed in court-ordered receivership this year declared $3.69 billion in assets, close to the $3.95 billion declared in the first nine months of 2025 and more than three times the $1.08 billion of January to September 2019.
The sharpest change is in British Columbia. Courts there appointed receivers 135 times from January to September 2026, compared with 101 in the same months of 2025 and just nine in 2019. The B.C. cases declared $1.68 billion in assets this year, more than Ontario’s $1.52 billion, even though Ontario had more cases. Ontario still leads in numbers, with 259 court-appointed receiverships, down from 309 a year earlier but almost three times the 90 of 2019. Quebec nearly doubled to 86 from 46 last year, and Alberta rose to 78 from 48. Manitoba, Saskatchewan and the Atlantic provinces had 16 between them, and the territories had none.
A second set of federal records points the same way: fewer business failures, but bigger ones. The Office’s postal-area statistics count business bankruptcies and proposals to creditors under the Bankruptcy and Insolvency Act, a separate process from receivership. There were 3,646 of those filings from January to September 2026, down from 4,853 in the same months of 2024. Yet the debts the businesses declared rose to $11.42 billion, from $6.32 billion in 2024 and $3.05 billion in 2021. The average filing declared $3.1 million in debts this year, against $1.3 million two years ago.
A few very large filings explain much of that. Seventeen monthly entries of $100 million or more, each for a single postal area, account for $6.26 billion, or 55% of all the business insolvency debt declared this year. Toronto postal areas, those beginning with the letter M, account for $4.24 billion, or 37% of the national total, from just 266 filings, or 7.3% of the count. In the downtown postal areas beginning with M5, which include the financial district, businesses declared $3.38 billion in debts this year, up from $344 million in the same months of 2025.
As we reported this week, transportation companies are filing for insolvency at twice their pre-pandemic pace, and small-business loans have fallen below 10% of all business credit in Canada. The receivership numbers add a different piece: the strain now shows up in court, among borrowers big enough to have secured lenders willing to go to a judge.
The records do not say who the businesses are, what industries they are in, or why they failed. The receivership file has no industry breakdown, so it cannot show whether the B.C. and Ontario increases are concentrated in one sector, such as real estate development, or spread across the economy. Competing explanations for the rise include higher borrowing costs after the Bank of Canada’s 2022 and 2023 rate increases, which hit borrowers who refinanced at higher rates, the slump in condominium building, with condo starts at their lowest since 2009, the end of pandemic-era relief, and U.S. tariffs. Some of the rise may also reflect lenders choosing court appointments over private ones, which would increase the court count without any change in the number of troubled borrowers. Filings under the Companies’ Creditors Arrangement Act, used by the largest companies, are not in either data set. No company is named or accused of anything here.
This story is part of our series on competition and small business in Canada.
How we checked: We downloaded the Office of the Superintendent of Bankruptcy’s historical receivership statistics, monthly (file dated September 2026), which gives the number of receiverships and the declared assets by province each month since December 1992, split into court and private appointments. We added January to September for each year so 2026 could be compared with the same months of earlier years; for example, 574 ÷ 228 = 2.5 times the 2019 total. We checked that the provincial rows add up to the national row. For business bankruptcies and proposals we used the Office’s monthly insolvency statistics by forward sortation area for 2021 to September 2026, adding the declared liabilities of business bankruptcies and business proposals in every postal area for January to September of each year. Postal areas are as declared by the debtors, and a postal-area entry can combine more than one filing in a month. The postal-area totals differ slightly from the Office’s industry file (3,646 filings this year in both, but 4,853 against 4,856 for 2024). Monthly figures can be revised. Declared assets and liabilities are as stated by debtors when they file and are not audited values.
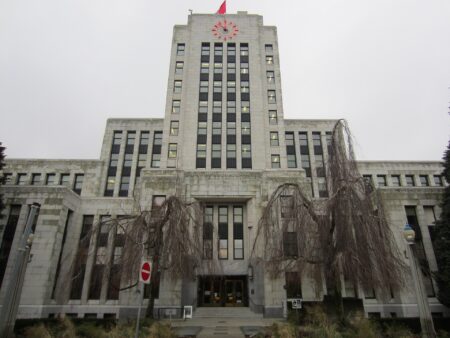
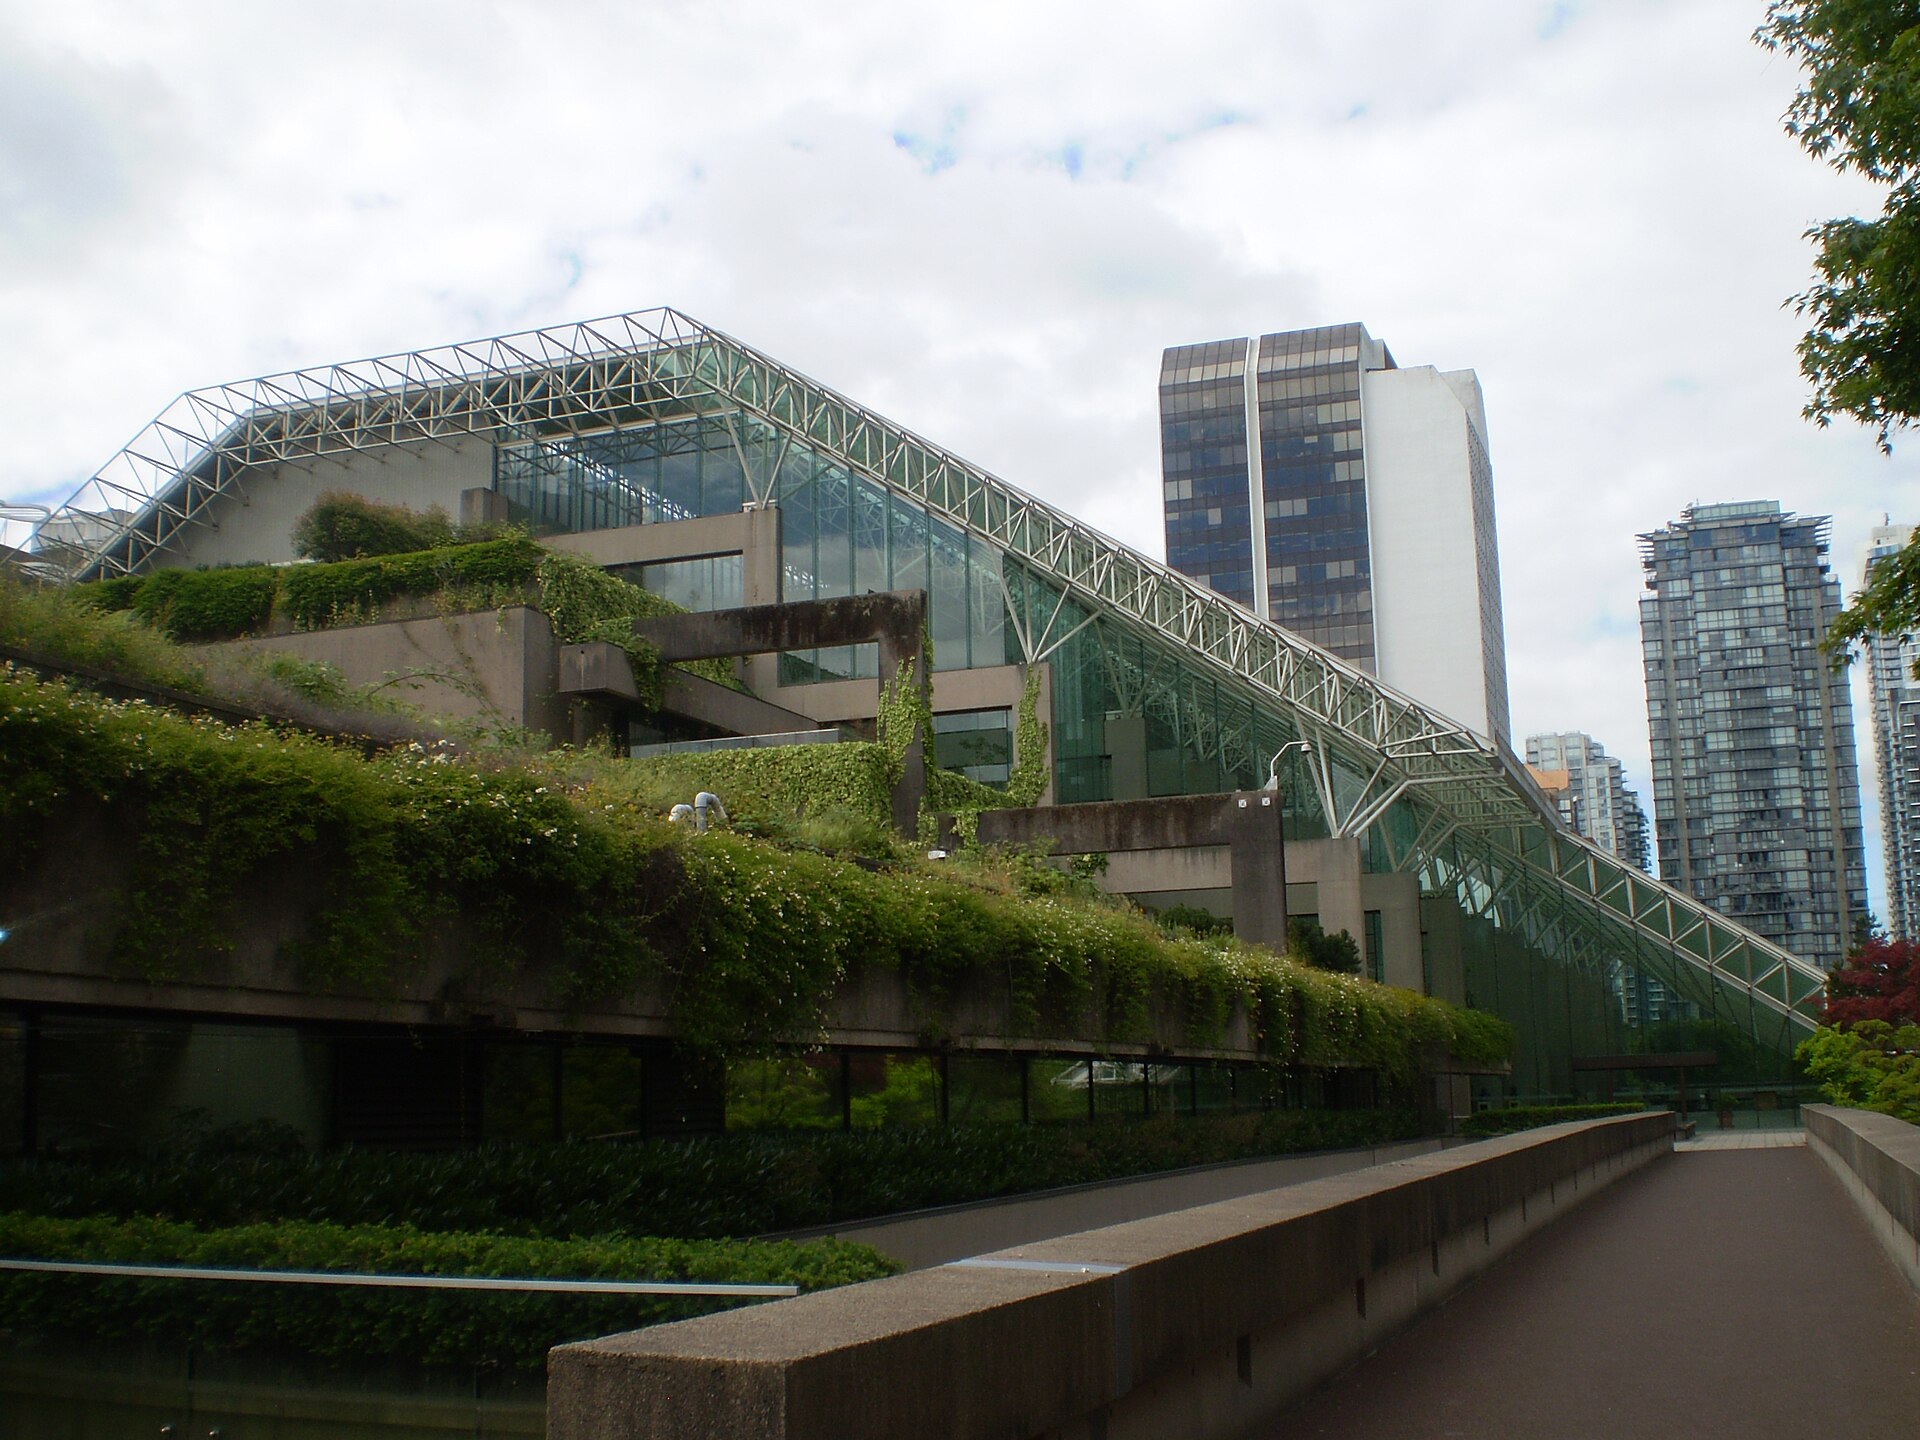
File photo: the Law Courts in Vancouver, home of the Supreme Court of British Columbia, June 27, 2026 (Ash-M-Bishop, CC0, via Wikimedia Commons). The building is shown for context and is not connected to any particular case.
Follow Canada News Media
Get the day's top Canadian stories and our two daily 60-second news videos wherever you scroll.
X Threads Facebook Instagram LinkedIn TikTok YouTube Pinterest Reddit Substack Flipboard Newsletter RSS