

The price Nova Scotians pay for water rose 22.2% in the past year, the steepest annual increase in the province since 1990 and more than four times the national rate, our analysis of Statistics Canada’s consumer price index shows.
The water component of the index for Nova Scotia stood at 292.7 in October 2026, up from 239.5 in October 2025. Across Canada, water prices rose 5.1% over the same 12 months, which is still faster than the 3.1% increase in prices overall. Nova Scotia’s jump came in two steps: the index rose 17.0% in January 2026 and another 3.7% in April, and was nearly flat after that.
Those months match the new rates at Halifax Water, the Halifax Regional Water Commission, which supplies water and wastewater service in the Halifax Regional Municipality. In December 2025, the Nova Scotia Regulatory and Appeals Board ruled on the utility’s request to raise residential water and wastewater rates by 15.8% on Jan. 1, 2026, and by another 17.1% on April 1, a combined 35.6% in three months. According to the board’s summary of the decision, higher rates were needed to cover rising costs, but some costs the utility wanted to pass on were “not justified or overestimated”, and the increases as proposed would amount to “rate shock”. The board refused to let the utility add $24.5 million to bills from April 1 to recover revenue it did not collect in 2025 because its rate application was filed late, and told it to propose spreading that recovery over several years. When the board approved the final rates on Jan. 14, 2026 (matter M12257), the estimated average residential bill rose 12.1% in January and 6% in April.
The price index and the board’s bill estimate measure different things, so they do not line up exactly. The index covers the whole province, not just Halifax, and tracks the price of water and related charges, while the board’s figure is an estimate of a typical residential bill. The index does not say which utilities’ rates are in it or how they are weighted.
Nova Scotia’s increase also stands out over a longer period. Since October 2019, its water index has risen 43.1%, the most of any province, against 29.6% for all prices in the province. Saskatchewan is next, with water up 38.4% since 2019 and 7.9% in the past year, followed by British Columbia at 32.9%, Ontario at 30.4% and Manitoba at 29.9%. Nationally, water prices are up 28.1% since 2019, compared with 24.7% for all items. In the past year, water rose faster than overall prices in eight of the 12 provinces and territorial capitals where Statistics Canada publishes a water index, including Whitehorse, where it rose 8.0%. It rose more slowly in Manitoba, New Brunswick, Newfoundland and Labrador and Prince Edward Island, where the increase was between 0.9% and 3.2%.
Water is supplied almost everywhere in Canada by a single local utility, usually owned by a municipality, so households cannot shop around when rates go up. That is why provinces such as Nova Scotia have an independent board review the rates, and why the costs a utility asks to recover are tested in public hearings. The records reported here do not show whether any rate is too high or too low.
What the data cannot tell us: the CPI does not show what an individual household pays, which depends on how much water it uses and whether it pays a flat or metered rate, and it does not separate water from wastewater or stormwater charges. Utilities across the country cite costs such as replacing aging pipes and treatment plants, meeting drinking water and wastewater rules, and inflation in construction and labour, and those costs differ from place to place. No utility or regulator is accused of anything here.
Halifax Water customers can find the approved rates and bill information on the utility’s rate application page, and the board’s decisions are public on the Nova Scotia Regulatory and Appeals Board website.
How we checked: We used Statistics Canada’s consumer price index, table 18-10-0004-01 (monthly, not seasonally adjusted, 2002=100), with data to October 2026, and compared the “Water” and “All-items” components for each province and territorial capital in October 2019, October 2025 and October 2026. For Nova Scotia, 292.7 ÷ 239.5 − 1 = 22.2%. To check the 1990 comparison, we calculated the 12-month change for every month in Nova Scotia’s water series; the only larger figure, by a fraction of a point, was in July 1990. The water index is updated only a few times a year, when utilities change rates, which is why it moves in steps. Details of the rate case come from the board’s December 16, 2025 decision summary and its January 14, 2026 news release on the final rates.
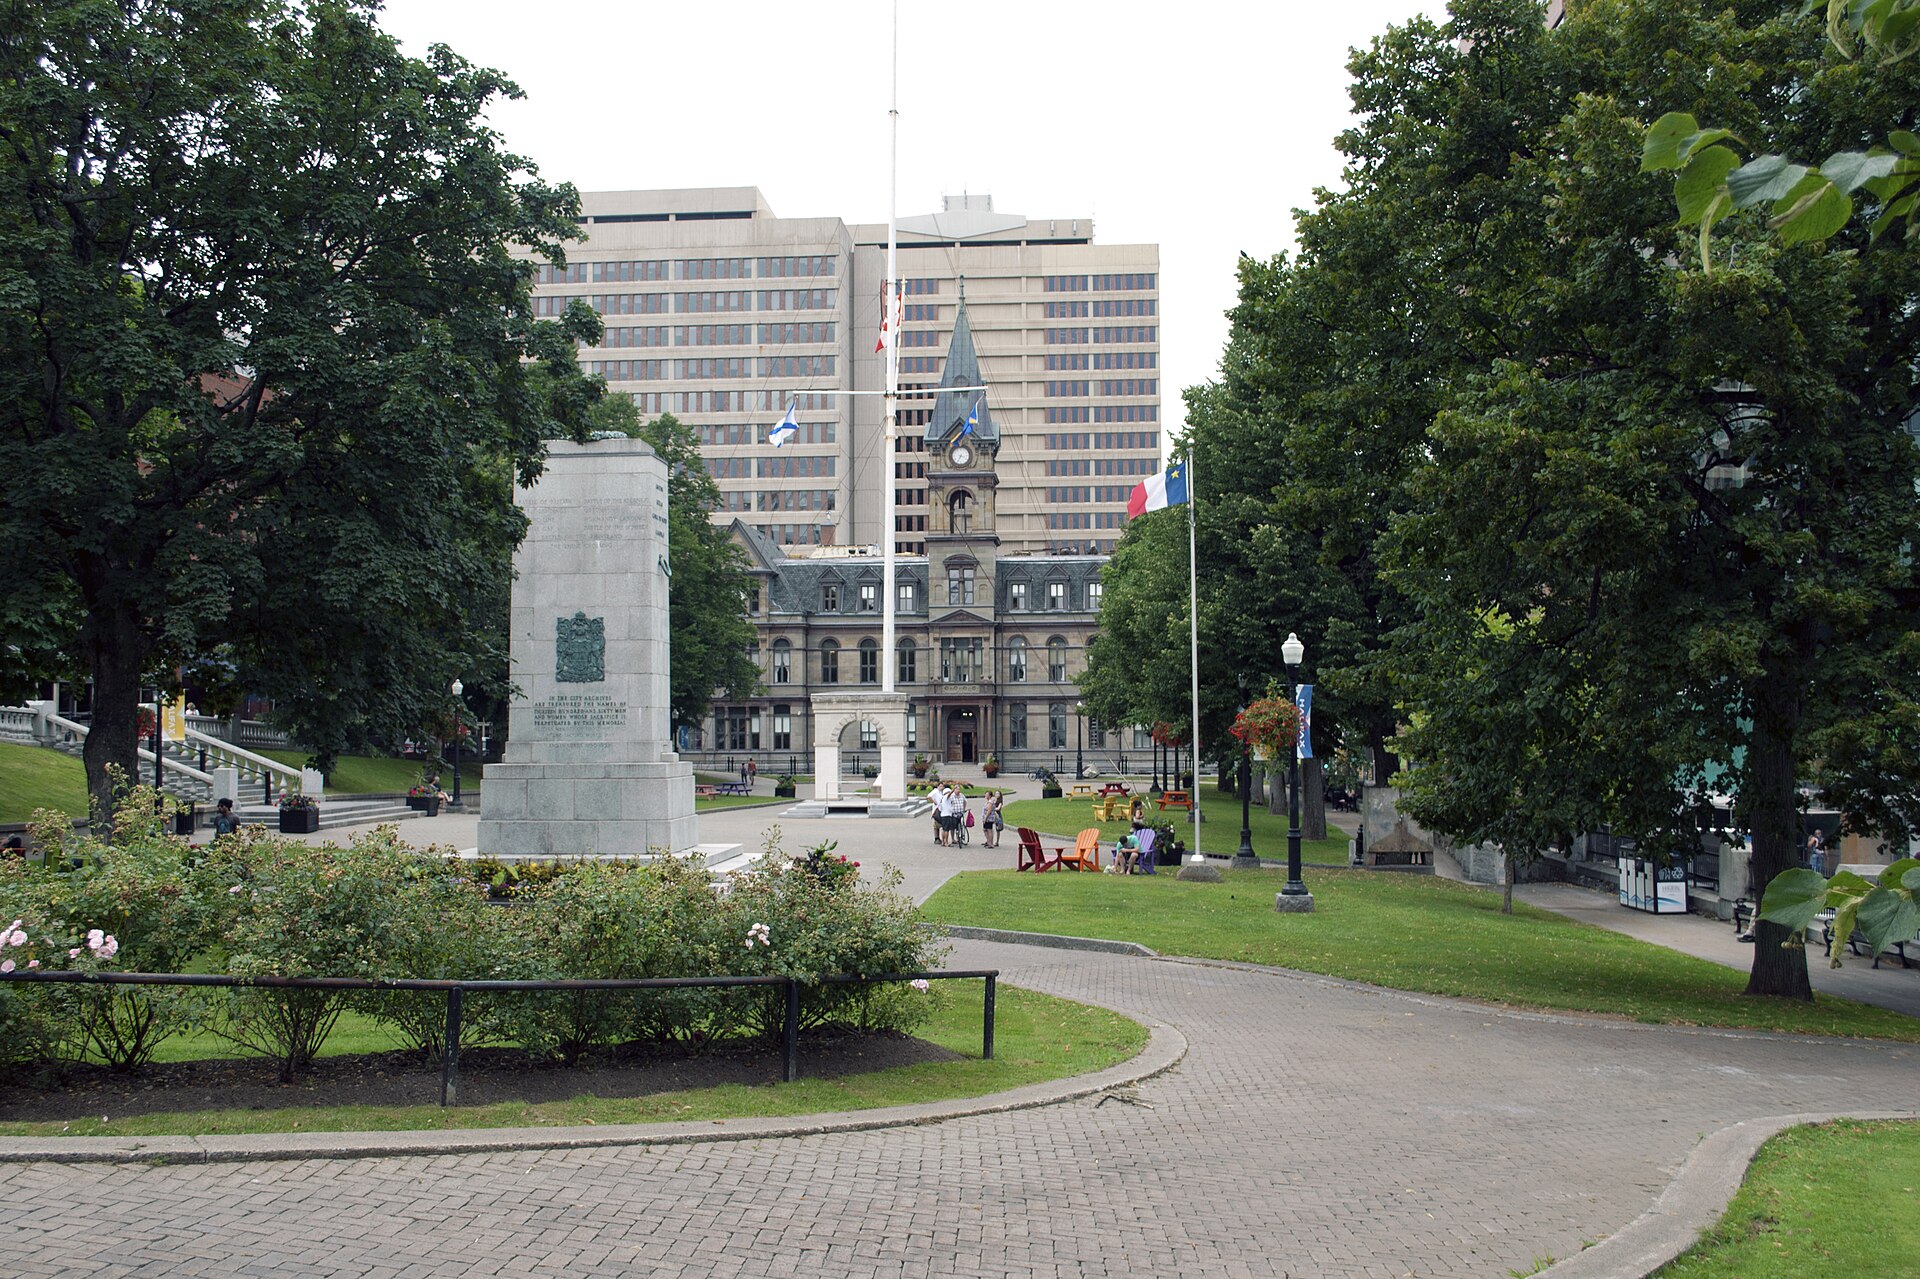
File photo: Grand Parade in Halifax looking north toward City Hall, Aug. 20, 2015 (WayeMason, CC BY-SA 4.0, via Wikimedia Commons). It is shown for context.
Follow Canada News Media
Get the day's top Canadian stories and our two daily 60-second news videos wherever you scroll.
X Threads Facebook Instagram LinkedIn TikTok YouTube Pinterest Reddit Substack Flipboard Newsletter RSS