


Ontario electricity customers spent more time without power in 2025 than in any year since at least 2015, and Hydro One customers went without electricity for an average of 45 hours, utility filings to the Ontario Energy Board show.
The province’s 53 local electricity distributors reported 78.8 million customer-hours of interruptions in 2025, according to the system reliability figures each utility must file with the energy board every year. A customer-hour is one customer without power for one hour. That total is the highest in the board’s published data, which starts in 2015. It tops 2022, the year of the May derecho windstorm, at 74.9 million, and is three times the 26.0 million of 2024. In a calm year such as 2019, the total was 20.6 million.
Spread across all 5.55 million customers, the average Ontario customer was without power for 14.2 hours in 2025, compared with 4.7 hours in 2024 and 13.8 hours in 2022. Utilities also recorded 76,555 separate interruptions, the most of any year in the data, and the average customer lost power about 2.5 times.
The filings show that weather drove the jump. Distributors attributed 59.8 million customer-hours, or 76% of the total, to adverse weather, including trees brought down onto lines by ice and wind and equipment broken by the weather. Utilities flagged 59.2 million customer-hours, or 75%, as coming from major events, the category for rare, severe incidents beyond what a utility could reasonably plan for. In 2024, major events accounted for 31%.
The data are annual and do not name events, but 2025 was the year of the late-March ice storm that hit central and eastern Ontario. In its first-quarter results of May 8, 2025, Hydro One called it a once-in-a-generation storm and said it performed more than 1.1 million service restorations affecting more than 600,000 customers.
Hydro One, the utility that serves most of rural and small-town Ontario, carried most of the losses. Its 1.5 million customers accounted for 68.2 million customer-hours, or 87% of the provincial total, and averaged 45.4 hours without power, compared with 12.8 hours in 2024 and 31.6 hours in 2022. Major events made up 54.6 million of Hydro One’s customer-hours.
The longest average outage of any utility was at InnPower, which serves Innisfil, south of Barrie: its 24,155 customers averaged 52.2 hours without power in 2025, up from 2.1 hours in 2024. Fort Frances Power averaged 33.5 hours, Lakeland Power, in the Bracebridge and Parry Sound area, 26.9 hours, and Newmarket-Tay Power 16.7 hours. Large urban utilities were barely touched by comparison: Toronto Hydro customers averaged 1.2 hours, Alectra’s 1.9 hours and Hydro Ottawa’s 1.8 hours.
The records also show which causes were not weather. Equipment failure accounted for 4.7 million customer-hours across the province, loss of supply from the transmission or distribution system 4.5 million, tree contacts outside storms 4.0 million and scheduled outages for maintenance 2.4 million. Equipment failures and scheduled outages were close to their 2023 and 2024 levels (4.3 million and 4.2 million customer-hours for equipment), while loss of supply was higher than in 2024, at 4.5 million against 3.7 million. Those non-weather causes together are far too small to explain the 2025 total, which came mostly from storm damage.
This story is part of our series on outages that hit Canadians. Earlier parts looked at stalled federal rules on telecom outage reporting and record cyber-security warnings in 2026.
The filings do not say whether any utility responded well or badly, and this story does not suggest that any did. Severe ice storms damage lines and poles faster than any crew can repair them, and the major-event category exists so utilities are not judged on events outside their control. The data do not show restoration times for individual customers, how many customers were out for days rather than hours, or what the outages cost households and utilities. The figures are as filed by the utilities and may be revised.
How we checked: We downloaded the Ontario Energy Board’s system reliability open data (Reporting and Record-keeping Requirements section 2.1.4.2, page last updated Oct. 19, 2026), which lists, for each distributor, year and cause of interruption from 2015 to 2025, the number of interruptions, customer interruptions and customer-hours, split between major and non-major events, and the average number of customers served. We added customer-hours from major and non-major events across all causes for each distributor and year. Average hours without power equal total customer-hours divided by customers served; for Hydro One in 2025, 68,247,610 ÷ 1,502,658 = 45.4. Because some customer counts for Hydro One before 2021 appear to cover only part of its system, we compare province-wide averages per customer only for 2021 onward; the customer-hour totals are compared for all years. Cause categories were split into finer codes from 2024; we grouped them by their main cause.
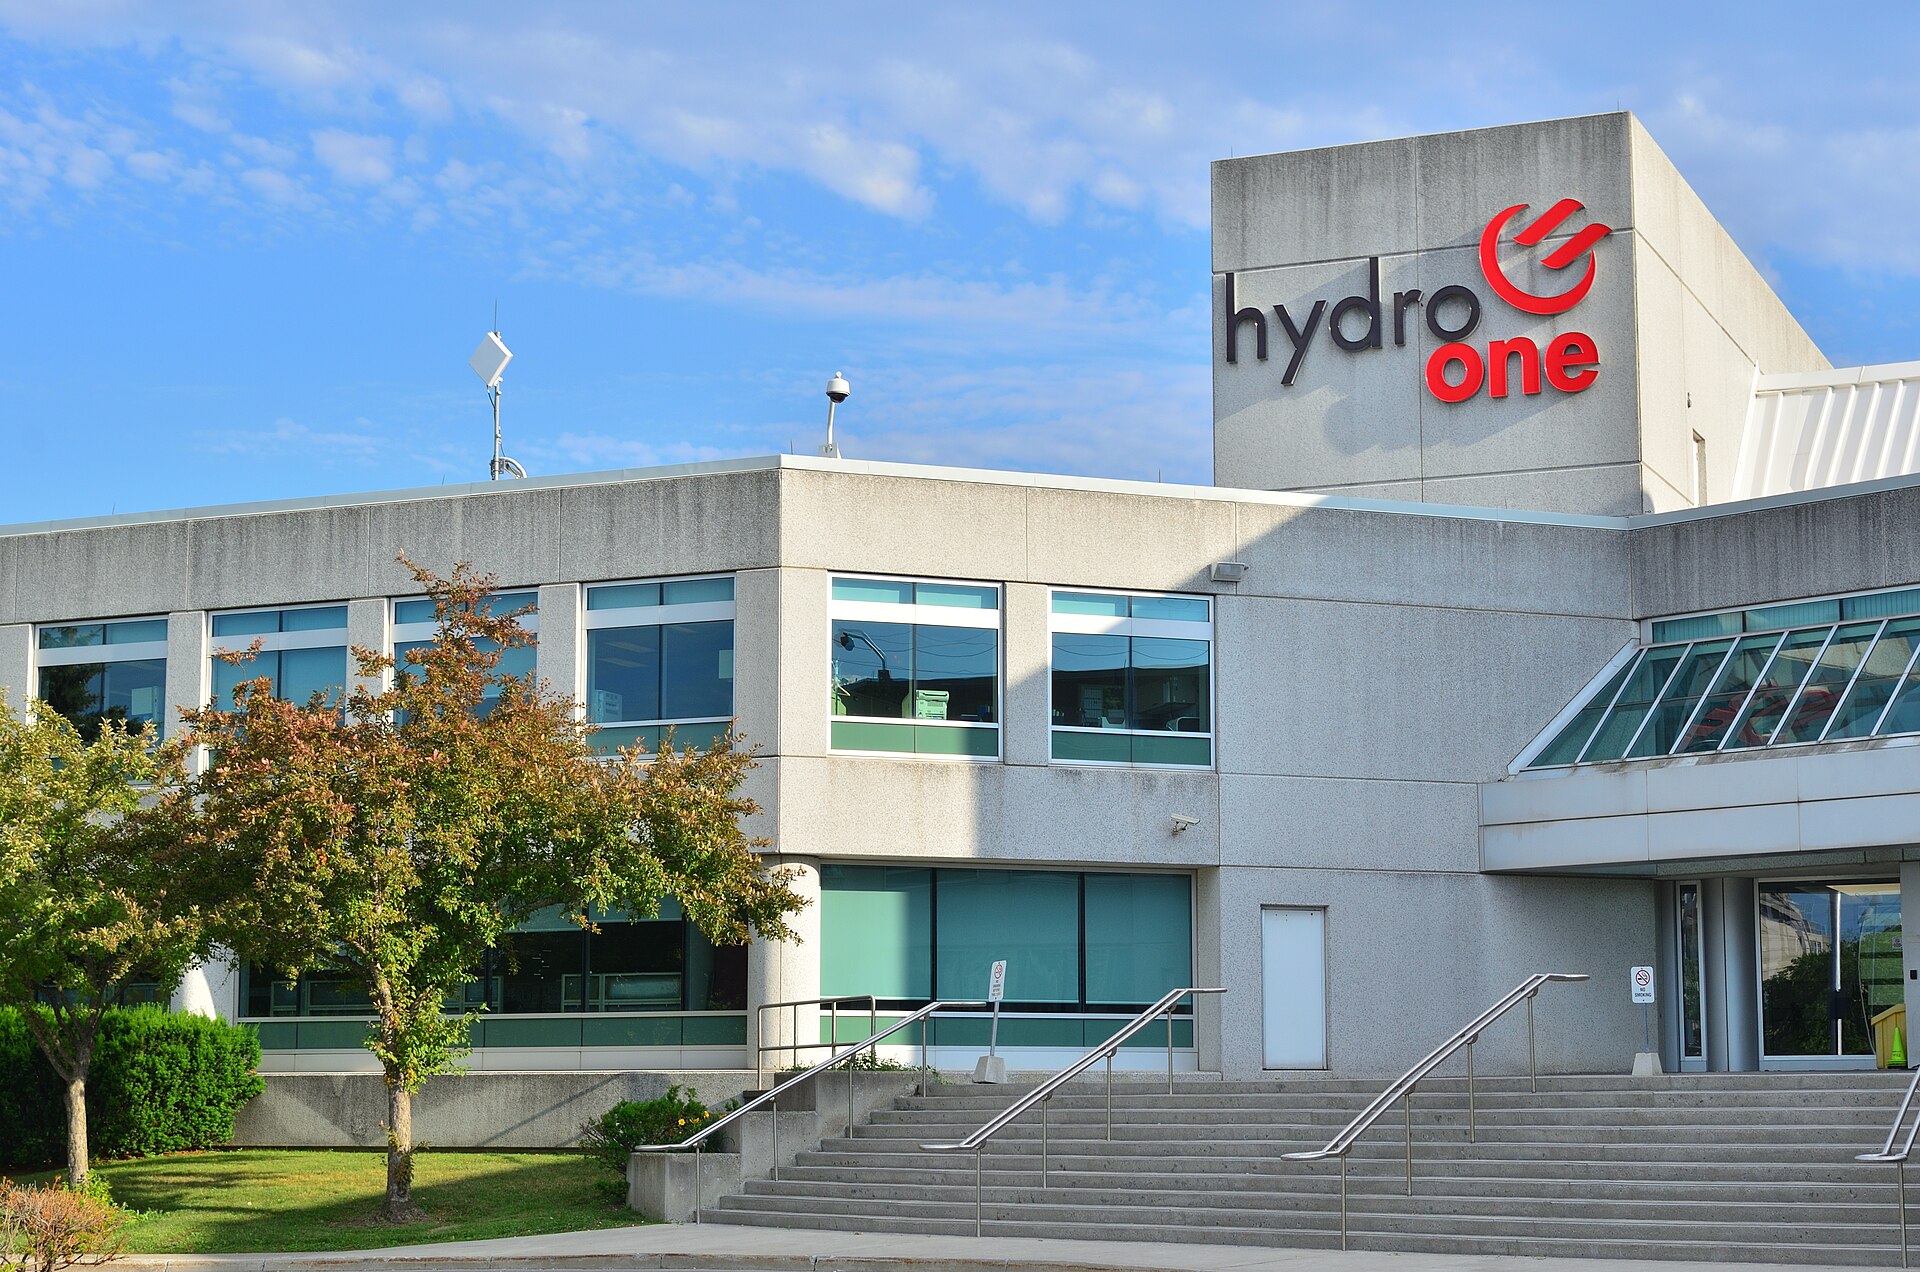
File photo: the Hydro One Networks building at 185 Clegg Road in Markham, Ont., July 9, 2018 (Raysonho, CC BY 4.0, via Wikimedia Commons). It is shown for context, not from the storm.
Follow Canada News Media
Get the day's top Canadian stories and our two daily 60-second news videos wherever you scroll.
X Threads Facebook Instagram LinkedIn TikTok YouTube Pinterest Reddit Substack Flipboard Newsletter RSS