
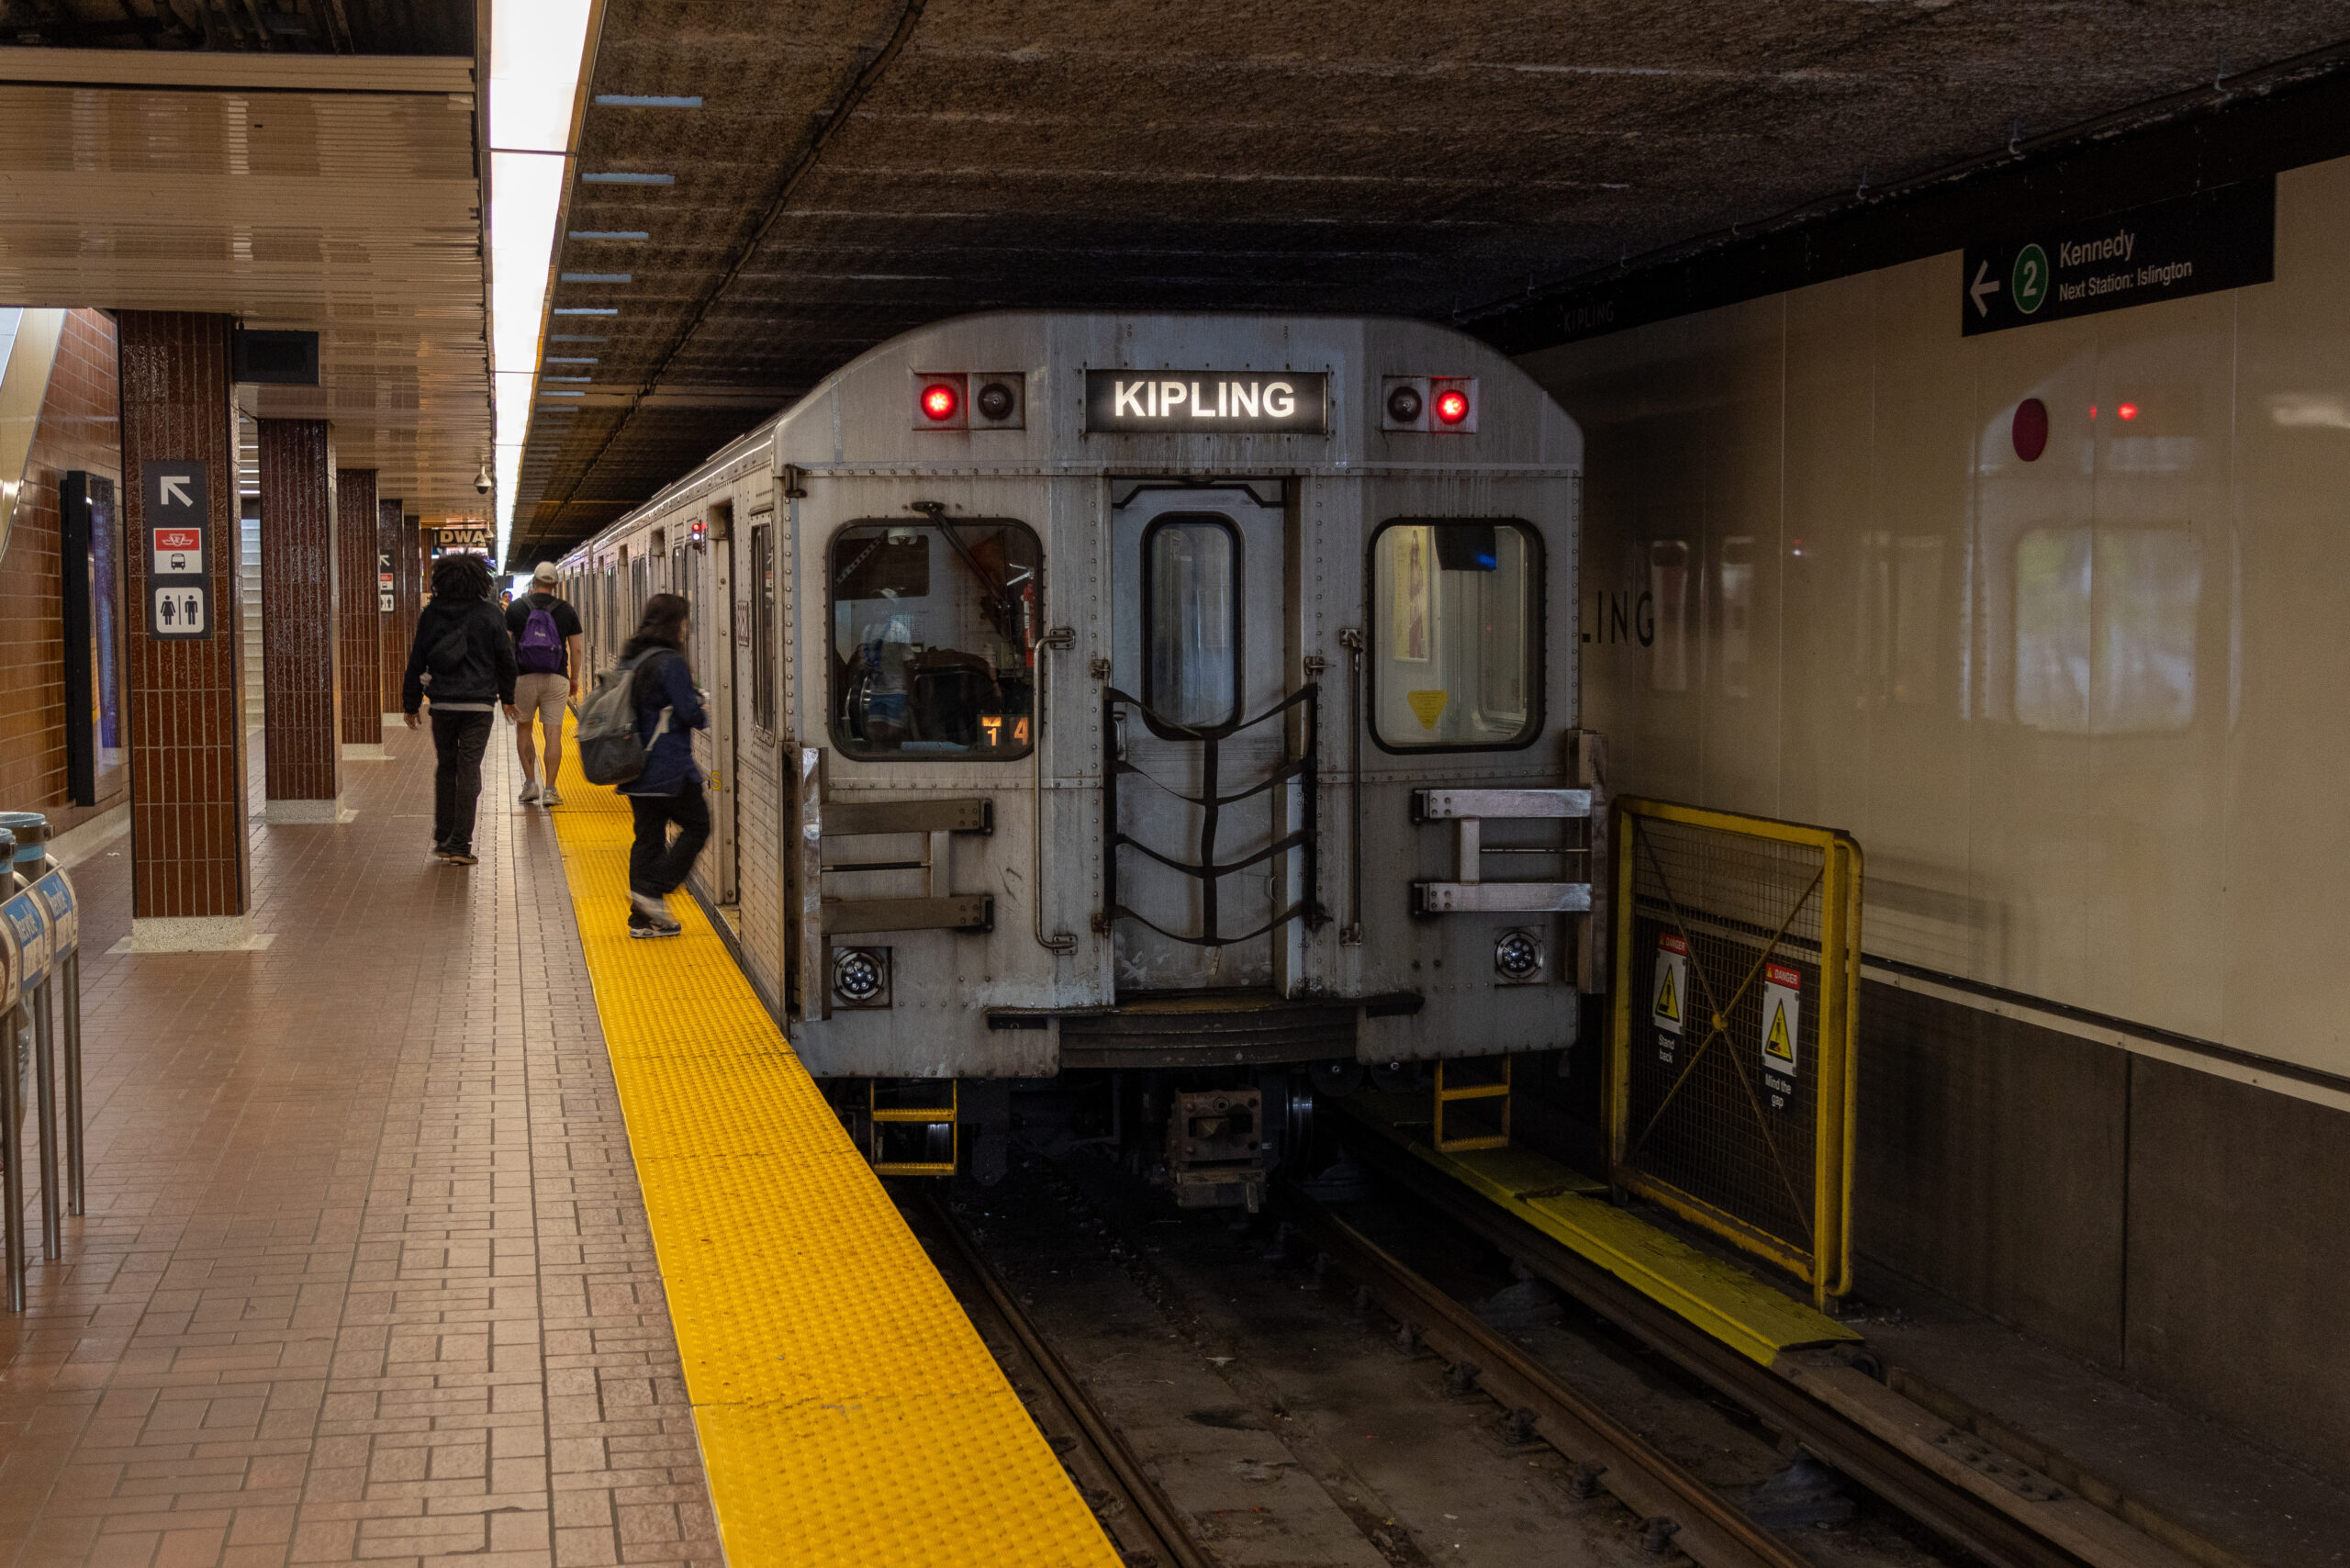
Delays on the TTC’s Line 2 Bloor-Danforth subway added up to 26,128 minutes in the first nine months of 2026, 29 per cent more than in the same months of 2025 and the most of the last three years, according to the transit agency’s own delay log.
The Toronto Transit Commission publishes every subway delay incident it records on the City of Toronto’s open data portal. Canada News Media counted every entry from Jan. 1 to Sept. 30 in each of 2024, 2025 and 2026. The latest file runs to Sept. 30, 2026.
Across the whole subway, the log grew to 22,178 entries in those nine months of 2026, up 15 per cent from 19,253 a year earlier and 12.6 per cent from 19,702 in 2024. Not every entry stops a train: 7,459 of this year’s entries recorded a delay of at least one minute, up from 6,715 in 2025 and 6,994 in 2024.
Total delay minutes rose more slowly than the number of incidents. They reached 55,910 minutes this year, up 5.5 per cent from 52,973 in 2025 and about one per cent above the 55,378 minutes logged in 2024.
The increase was not shared evenly. On Line 1 Yonge-University, delay minutes fell nearly nine per cent, from 30,391 to 27,696. Line 4 Sheppard fell from 2,311 to 2,000 minutes. Line 2 went the other way: 26,128 minutes this year against 20,254 in 2025 and 21,885 in 2024, and the number of Line 2 entries rose to 9,715 from 8,349 in 2025 and 8,026 in 2024.
Winter accounts for part of the jump. The storm of Jan. 25 and 26, 2026 produced 5,584 delay minutes across the subway in two days, 2,861 of them on Line 2, and January 2026 was the worst month in the 21-month file with 12,376 minutes. Delays the TTC coded as ice or snow problems on Line 2 totalled 2,740 minutes this year, compared with 99 minutes in the first nine months of 2025.
Even without those two storm days, however, Line 2 logged 23,267 delay minutes this year, still more than in the full January-to-September period of either 2024 or 2025.
Other causes also grew on Line 2. Delays coded to work vehicles rose to 1,148 minutes from 157, including a 484-minute delay at Old Mill station starting at 5:46 a.m. on April 7. Delays the TTC listed as equipment problems of all kinds on the line totalled 2,911 minutes, up from 2,091 in 2025 and 2,677 in 2024. Customers taken ill on trains who then refused medical aid accounted for 1,915 minutes, up from 1,363.
The log also shows how security incidents are being recorded. Entries in the TTC’s security categories totalled 6,812 across the subway this year, compared with 4,746 in 2025 and 6,278 in 2024. Part of that rise comes from a new code, “SUL,” which first appears on April 1, 2026 and accounts for 1,305 entries. It is not defined in the code list the TTC publishes with the data. Without it, security entries numbered 5,507.
Within those categories, entries for disorderly patrons rose to 2,422 from 2,125 in 2025 (there were 2,590 in 2024), while entries for assaults involving a customer fell to 378 from 495 in 2025 and 421 in 2024. Assaults involving an employee were steady at 173, against 171 a year earlier.
The records have limits. The log counts incidents and minutes as TTC staff code them; it does not say how many riders were affected, and a single event can produce several entries at different stations. Codes can change over time, as the new “SUL” code shows, so category totals are not always comparable year to year. The data does not explain why Line 2 delays rose, and the TTC has not published a cause for the increase in the dataset. The figures cover Jan. 1 to Sept. 30 only; October to December are not yet in the file.
For riders, the practical point is the difference between lines. A Line 2 rider has seen noticeably more delay time this year than last, while Line 1 riders have seen less. The TTC posts service alerts on its website and on its social media accounts, and the city’s open data file is updated monthly.
How we checked: We downloaded the TTC’s subway delay data from the City of Toronto open data portal on Nov. 21, 2026: the “since 2025” file (47,915 entries, Jan. 1, 2025 to Sept. 30, 2026) and the 2024 annual file (26,467 entries). We counted entries and added the “Min Delay” column for Jan. 1 to Sept. 30 of each year, by line and by delay code, and matched codes to the TTC’s published code descriptions. “Security categories” means codes beginning with SU; “equipment” means codes beginning with E. Every total was calculated twice, once in a database and once by a separate script, and matched. Entries for combined or blank line labels are included in system-wide totals but not in any one line’s figures.
Follow Canada News Media
Get the day's top Canadian stories and our two daily 60-second news videos wherever you scroll.
X Threads Facebook Instagram LinkedIn TikTok YouTube Pinterest Reddit Substack Flipboard Newsletter RSS