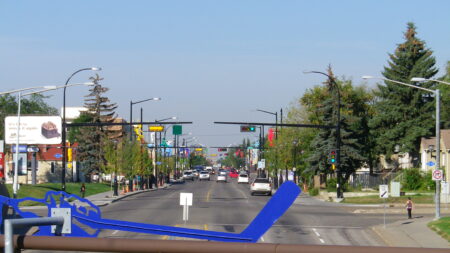


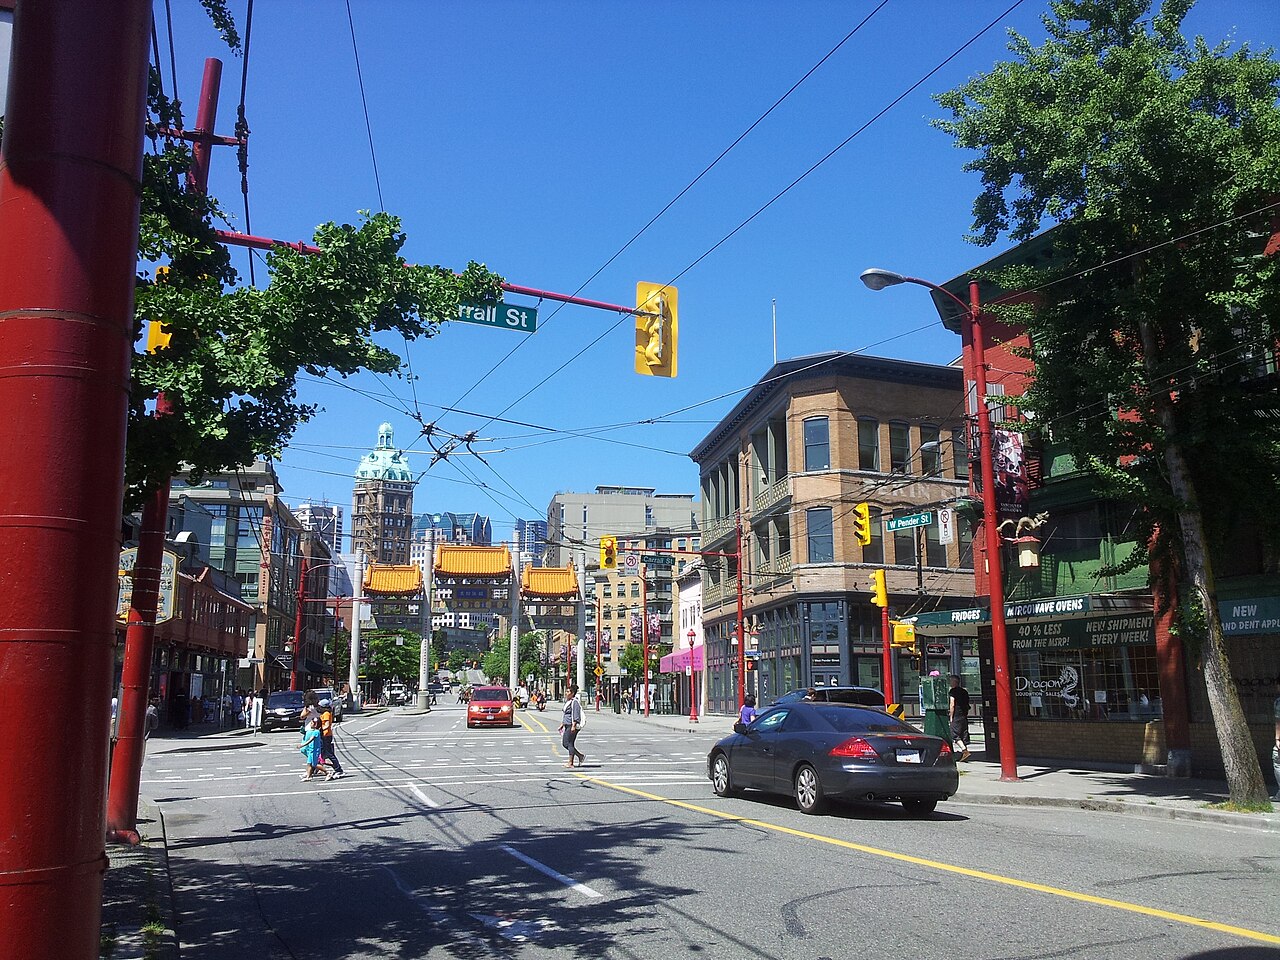
About one in five storefronts sat empty this spring in three neighbouring districts just east of downtown Vancouver, Chinatown, Strathcona and Hastings Crossing, even as vacancies across the city fell to their lowest level in seven years of counts, according to a Canada News Media analysis of the city’s storefront inventory.
The City of Vancouver surveys its storefronts each spring, in March and April, and records the use of each one, publishing the results as the storefronts inventory open dataset. The 2026 count found 1,009 of 9,610 storefronts vacant, or 10.5 per cent, counting both of the inventory’s vacancy categories, “Vacant” and “Vacant UC.” That is down from 11.9 per cent in 2020 and a peak of 13.2 per cent in 2021, and the lowest of the seven counts since 2020.
The recovery has passed some neighbourhoods by. In the Hastings Crossing business improvement area, 44 of 214 storefronts were vacant in 2026, or 20.6 per cent. Strathcona had 41 empty out of 204, or 20.1 per cent, and Chinatown 56 of 289, or 19.4 per cent. Those three areas had the highest vacancy rates of the city’s 22 business improvement areas, roughly double the citywide rate.
Chinatown’s rate has not fallen below 16.8 per cent in any count since 2020. It was 17.0 per cent in 2020, peaked at 21.1 per cent in 2023, eased to 17.2 per cent in 2025 and rose again to 19.4 per cent this year, when it had more empty storefronts, 56, than any area except the downtown and Mount Pleasant business districts. Hastings Crossing has improved from a peak of 32.4 per cent in 2024, when 72 of its 222 storefronts were empty, but remains the highest in the city. Strathcona was at 30.9 per cent in 2020 and 26.2 per cent in 2021, and has stayed between 17 and 23.2 per cent since.
Six business improvement areas had a higher vacancy rate in 2026 than in 2020: Chinatown, Hastings Crossing, Gastown (13.1 per cent, up from 10.6), the Downtown Vancouver area (11.8 per cent, up from 8.2), South Hill on Fraser Street (8.1 per cent, up from 6.5) and Yaletown, which was essentially unchanged at 7.1 per cent. The other 16 were lower. The downtown comparison needs care, because the city counted far more storefronts there in 2026, 1,079, than in 2020, 722.
The lowest vacancy rates this year were along West Broadway, where 9 of 249 storefronts were empty (3.6 per cent), Victoria Drive (4.7 per cent) and Kerrisdale (5.3 per cent). West Broadway, Point Grey, West Fourth Avenue in Kitsilano and Robson Street all cut their vacancy rates by more than four percentage points from 2020. Robson Street went from 19.7 per cent to 9.0 per cent.
The inventory also shows what kind of businesses are filling Vancouver’s storefronts. Between 2020 and 2026, the number of food and beverage storefronts rose 19.8 per cent, to 2,459, and storefronts the city classes as service commercial rose 23.3 per cent, to 3,057. Convenience-goods stores grew 27.1 per cent, to 1,246. Shops in the city’s comparison-goods category barely moved, from 1,434 to 1,451, so their share of all storefronts fell to 15.1 per cent from 17.5 per cent. Some of that growth reflects the city counting more storefronts overall, 17 per cent more than in 2020.
The records do not explain why some districts lag. They do not record rents, the length of vacancies, ownership, whether a unit is being renovated or held off the market, or how street conditions, crime or construction affect individual blocks, and they name no landlord. The inventory is a single snapshot each spring, so a storefront that opened or closed later in the year is not reflected until the next count. The city says locations are accurate to the block, not the exact door.
For small-business owners looking for space, the figures point to where vacant storefronts are concentrated and where competition for space is tightest. The full list of storefronts, by address and business category, is in the city’s open dataset.
How we checked: We queried the City of Vancouver’s storefronts inventory on Nov. 21, 2026, counting all storefronts and vacant storefronts (categories “Vacant” and “Vacant UC”) by year recorded and business improvement area for 2020 to 2026, and counting storefronts by general business category for 2020 and 2026. Storefronts outside any business improvement area are included in the citywide totals. Vacancy rates are vacant storefronts divided by all storefronts counted in that area that year. Every figure was checked twice.
Follow Canada News Media
Get the day's top Canadian stories and our two daily 60-second news videos wherever you scroll.
X Threads Facebook Instagram LinkedIn TikTok YouTube Pinterest Reddit Substack Flipboard Newsletter RSS