


About 7.47 million people in Canada’s ten provinces lived in households that were moderately or severely food insecure in 2024, up from 4.02 million in 2019, according to our analysis of Statistics Canada’s Canadian Income Survey. That is 18.4 per cent of the population, compared with 10.9 per cent five years earlier. The 2024 figure is slightly below the 2023 peak of 7.64 million (19.4 per cent), but it is still 86 per cent higher than before the pandemic.
The most serious category grew fastest. People in severely food-insecure households, which Statistics Canada measures from reports of reduced food intake and disrupted eating because of a lack of money, rose from 1.22 million in 2019 to 2.65 million in 2024, more than double. Children are hit hardest: 1.86 million people under 18 lived in a moderately or severely food-insecure household in 2024, or 24.0 per cent of all children, up from 962,100 (13.5 per cent) in 2019. The children’s rate peaked at 25.0 per cent in 2023.
Every province worsened between 2019 and 2024, but not by the same amount. Alberta had the highest 2024 share at 22.8 per cent (13.2 per cent in 2019), followed by Manitoba at 22.3 per cent (12.6), New Brunswick at 20.9 (10.9), Newfoundland and Labrador at 20.4 (12.3), Ontario at 20.2 (11.4), Saskatchewan and Nova Scotia at 19.7 each (12.2 and 12.4), Prince Edward Island at 18.9 (13.0) and British Columbia at 17.4 (12.0). Quebec stands out: 12.1 per cent in 2024, up from 7.2 per cent, the lowest share of the ten provinces both years and well under the national figure. New Brunswick’s rate rose by the most, 10.0 percentage points, and Quebec’s by the least, 4.9.
Because of its size, Ontario accounts for the largest number: 3.22 million people in 2024, about 43 per cent of the national total, against 1.65 million in 2019. Alberta had 1.11 million people (566,800 in 2019) and Quebec 1.08 million (600,200). B.C. had 964,200.
| Province | Share moderately or severely food insecure, 2019 | 2024 | Change (points) | People, 2024 |
|---|---|---|---|---|
| Alberta | 13.2% | 22.8% | +9.6 | 1,109,800 |
| Manitoba | 12.6% | 22.3% | +9.7 | 313,100 |
| New Brunswick | 10.9% | 20.9% | +10.0 | 175,000 |
| Newfoundland and Labrador | 12.3% | 20.4% | +8.1 | 109,300 |
| Ontario | 11.4% | 20.2% | +8.8 | 3,220,200 |
| Saskatchewan | 12.2% | 19.7% | +7.5 | 231,000 |
| Nova Scotia | 12.4% | 19.7% | +7.3 | 207,100 |
| Prince Edward Island | 13.0% | 18.9% | +5.9 | 33,600 |
| British Columbia | 12.0% | 17.4% | +5.4 | 964,200 |
| Quebec | 7.2% | 12.1% | +4.9 | 1,076,800 |
| Canada | 10.9% | 18.4% | +7.5 | 7,471,500 |
The table does not say why the numbers rose, and a single cause cannot be read from it. The sharpest jump came in 2022, when the national share went from 12.9 to 17.0 per cent, a period of fast-rising grocery prices; our earlier analyses found that the average household’s grocery bill was $728 higher in 2023 than in 2019 and that beef prices were up as much as 118 per cent since 2019. But the survey measures a household’s inability to afford enough food, which also depends on rent, wages, benefits and debt. The gap between Quebec and the other provinces could reflect differences in housing costs, income support, child-care costs or the way households answer the survey, and these records cannot sort those explanations. An earlier report looked at a narrower group, Canadians with disabilities.
The data have limits. The Canadian Income Survey covers the ten provinces and excludes people living on reserves and other Indigenous settlements, so the figures leave out some of the communities where food costs are highest. The national estimates carry Statistics Canada’s quality rating of B, but most provincial estimates are rated C or D, so small differences between provinces, such as Saskatchewan and Nova Scotia, should not be read as real gaps. Statistics Canada revised the 2018 to 2023 estimates with the 2024 release, so earlier published figures may differ slightly. The statistics describe the previous 12 months for the household, not a single point in time, and they are survey estimates, not a count of food bank visits.
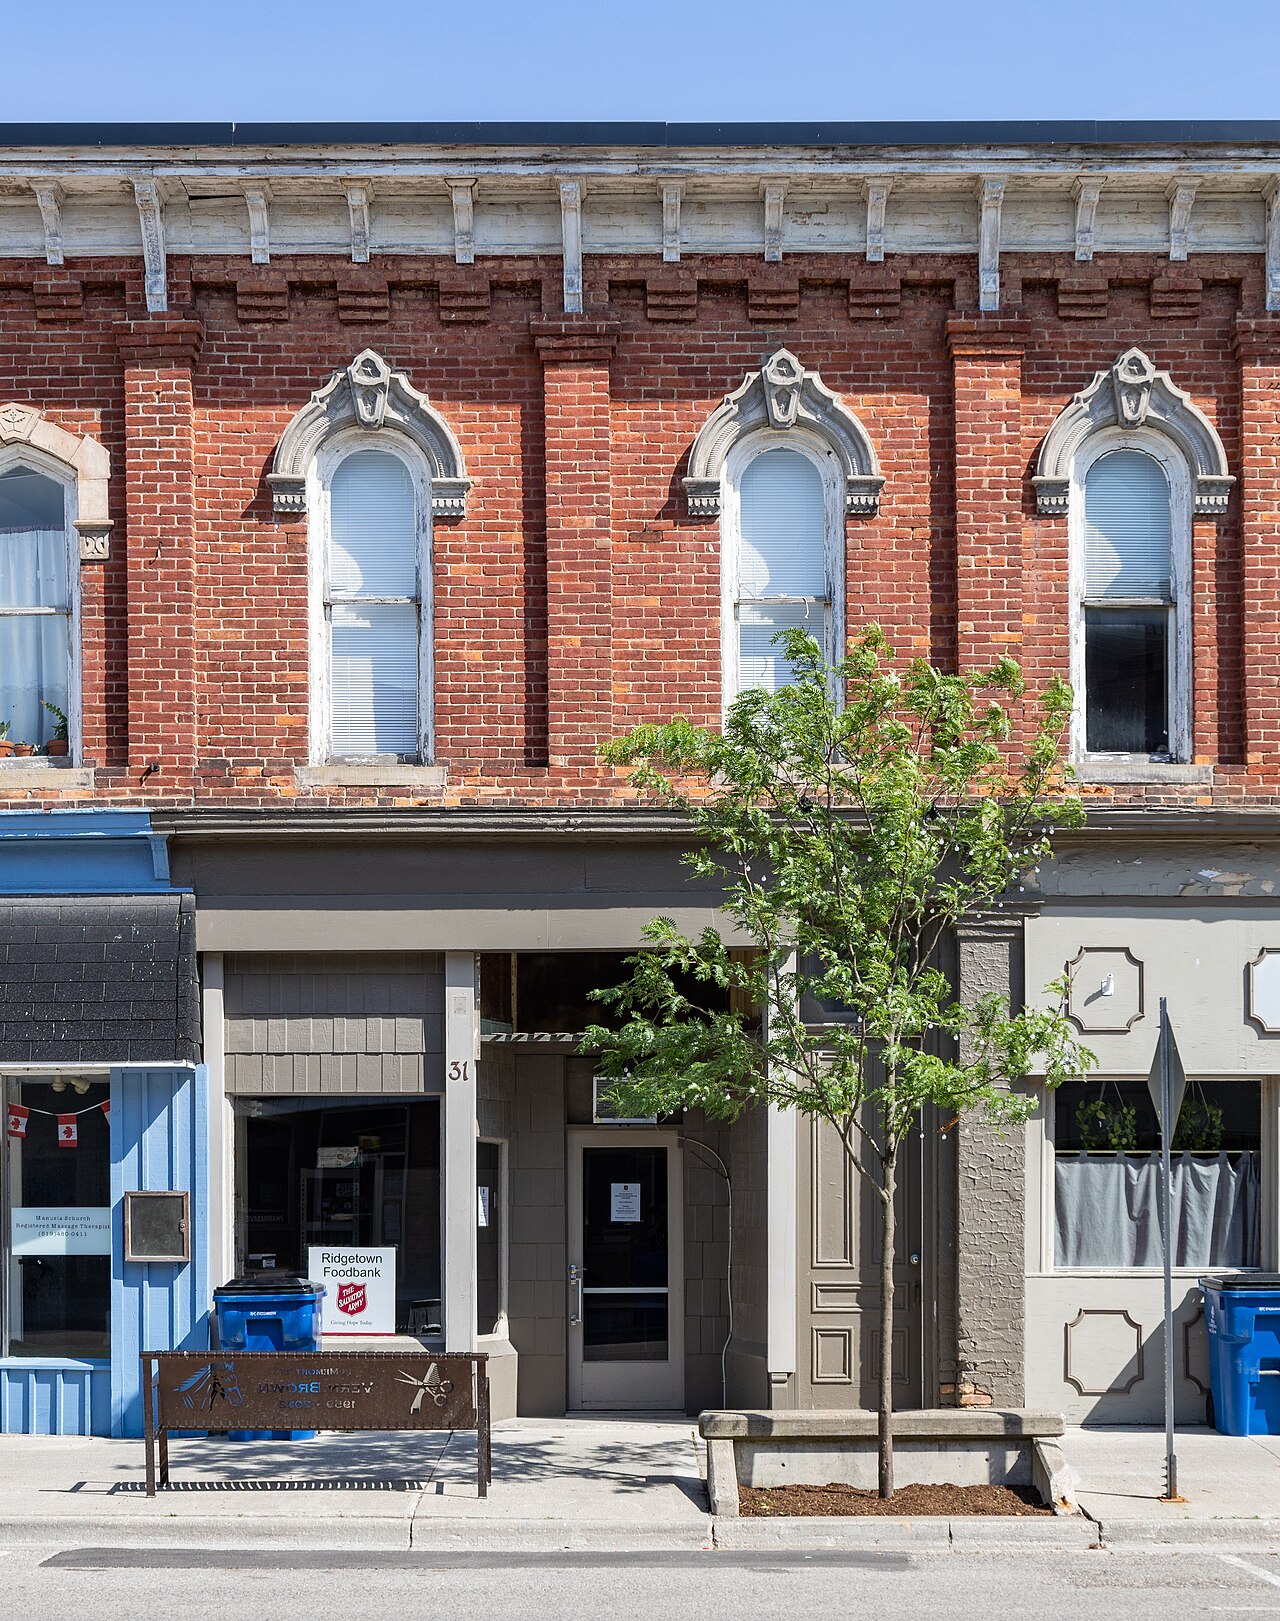
How we checked: We downloaded Statistics Canada table 13-10-0835-01 (Canadian Income Survey, household food security status by demographic characteristics) on Nov. 18, 2026, and used the category “Food insecure, moderate or severe” for all persons and for persons under 18, plus the “severe” category for Canada, for 2018 to 2024. Percentages and counts are Statistics Canada’s own published values. The percentage-point changes, the 86 per cent rise (7,471,500 against 4,022,800), Ontario’s 43 per cent share (3,220,200 of 7,471,500) and the ranking of the provinces are our calculations. The photograph, taken in July 2025, shows a Salvation Army food bank in Ridgetown, Ontario, and is a file photo by Chris Woodrich, licensed CC BY-SA 4.0 via Wikimedia Commons.
Follow Canada News Media
Get the day's top Canadian stories and our two daily 60-second news videos wherever you scroll.
X Threads Facebook Instagram LinkedIn TikTok YouTube Pinterest Reddit Substack Flipboard Newsletter RSS