

The average home in the Greater Toronto Area sold for less than $1 million in August for the second time this year, the Toronto Regional Real Estate Board (TRREB) reported, even as the Winnipeg Regional Real Estate Board (WRREB) reported the highest year-to-date average prices in its history for the same month. Both boards released their figures on Sept. 3, and together they show how a single national number can hide sharply different local markets underneath it.
TRREB said 5,057 homes changed hands across the GTA in August, down 2.1 per cent from a year earlier. The average selling price was $993,410, down 2.7 per cent year over year, and the board’s composite benchmark price fell 4.5 per cent over the same period. New listings totalled 12,075, a drop of 14.1 per cent from August 2025. TRREB president Daniel Steinfeld said the tighter listings pool leaves buyers weighing a real trade-off: “if inventory tightens and home prices begin to rise, some buyers may face a trade-off between waiting for greater economic certainty and purchasing before prices move higher.” It was the second time in 2026 the GTA average dipped below $1 million: the average also briefly fell below that mark in January, which was itself the first sub-$1-million reading for the board in five years.
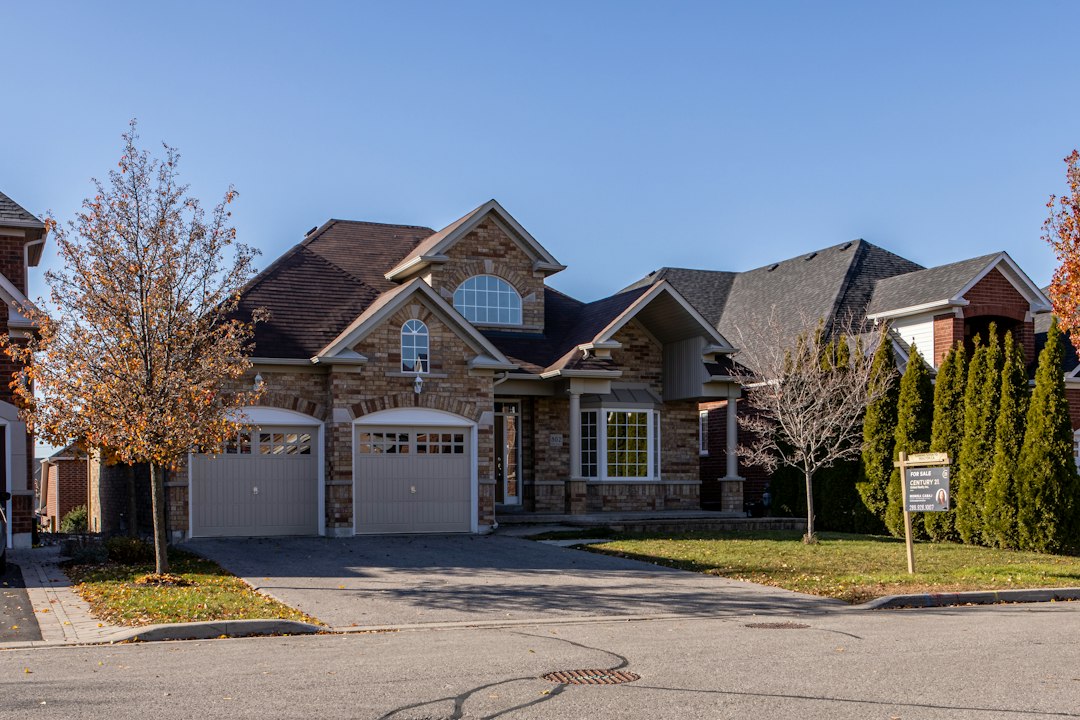
Illustrative stock photography of a house exterior in Ontario, not the specific properties discussed in this report. Photo by Dillon Kydd / Unsplash.
More than 2,300 kilometres west, the Winnipeg Regional Real Estate Board posted the opposite result. It said the year-to-date average price for a residential detached home through August was $468,679, up 3 per cent from the same period in 2025 and 8 per cent above the five-year average, calling it the highest on record. Condominiums told the same story: a year-to-date average of $288,834, also a record, up 3 per cent year over year. WRREB board president Dan O’Brien said in the release that the year-to-date detached and condominium averages “were the highest on record.”
Winnipeg’s record prices are not the product of a buying frenzy. Sales there fell too. The board recorded 1,326 MLS sales in August, down 5 per cent year over year, and 10,086 for the year to date, down 6 per cent. Detached-home sales alone were down 7 per cent year to date and condominium sales down 10 per cent. Rising average prices next to falling sales volumes points to thin, persistent inventory pressure in the city rather than a surge of competing buyers, though WRREB’s release did not break out month-by-month active listings for comparison.

Illustrative stock photography of prairie-style housing, not the specific properties discussed in this report. Photo by Priscilla Du Preez / Unsplash.
The national backdrop helps explain why the two cities are moving in opposite directions. The Canadian Real Estate Association reported that home sales fell 6.9 per cent year over year in August and its national home price index was down roughly 3 per cent, a slowdown it linked to renewed economic uncertainty. Against that backdrop, Toronto’s slide lines up with a market carrying some of the deepest listings losses in the country, while Winnipeg’s record prices line up with one of the thinnest inventories relative to demand.

Illustrative stock photography of a kitchen interior, not the specific properties discussed in this report. Photo by Lotus Design N Print / Unsplash.
The divergence extends beyond these two cities. The Calgary Real Estate Board has reported its own price declines this year concentrated heavily in the apartment condominium segment, a trend its chief economist, Ann-Marie Lurie, has attributed to several consecutive years of high construction meeting a sudden drop in migration, a dynamic she said has hit higher-density housing hardest. Ground-oriented housing in several Prairie markets, including Winnipeg’s, has held up far better by comparison, underscoring that even within one region, price trends can split sharply by property type as much as by city.
For buyers watching the national headlines, the lesson in August’s numbers is that “the Canadian housing market” is really dozens of distinct markets, each moving on local supply, migration and construction cycles more than on the national interest-rate story alone. A buyer priced out of a shrinking Toronto listings pool and a buyer chasing a record-priced Winnipeg bungalow are living through the same month in very different markets.
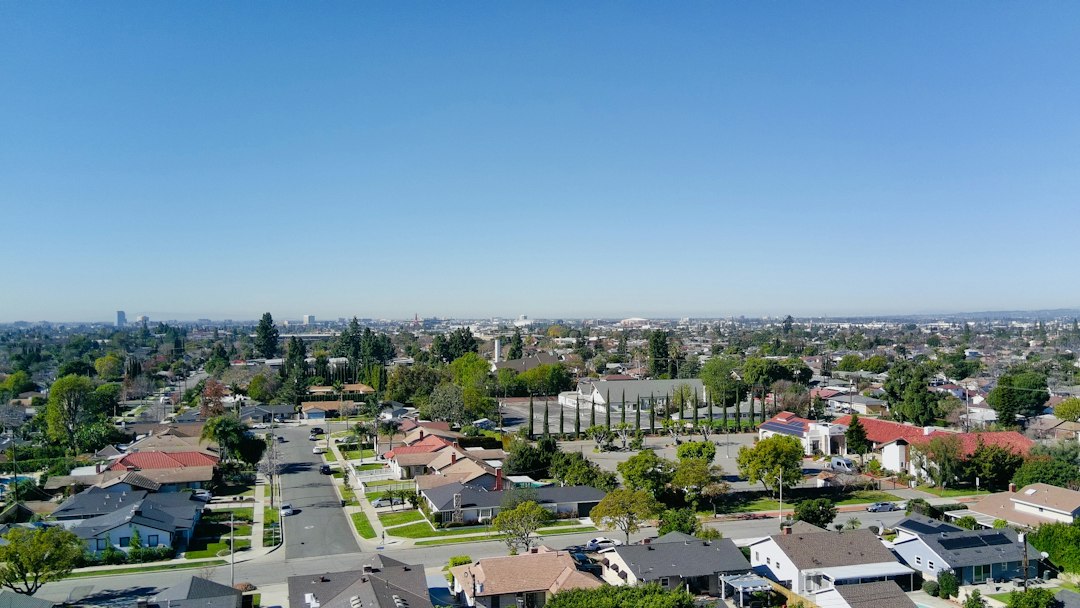
Illustrative stock photography of a residential neighbourhood, not the specific properties discussed in this report. Photo by Ty Dennis / Unsplash.