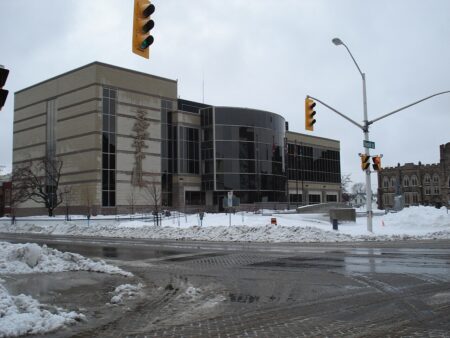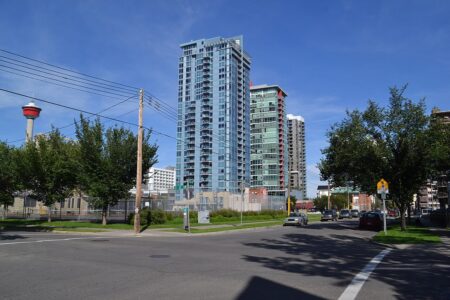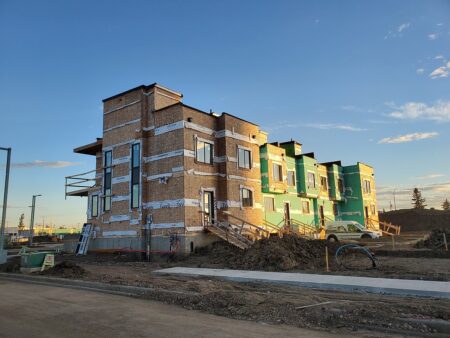



Apartments built since 2015 had a higher vacancy rate than the rest of the rental stock in 14 of 16 Canadian areas where the Canada Mortgage and Housing Corporation publishes the figure, according to the agency’s 2025 Rental Market Report tables. The widest gap was in Vancouver, where 7.9 per cent of units in buildings completed in 2015 or later were vacant in October 2025, against 3.7 per cent across all ages, and the Vancouver figure for newer buildings was 3.3 per cent a year earlier.
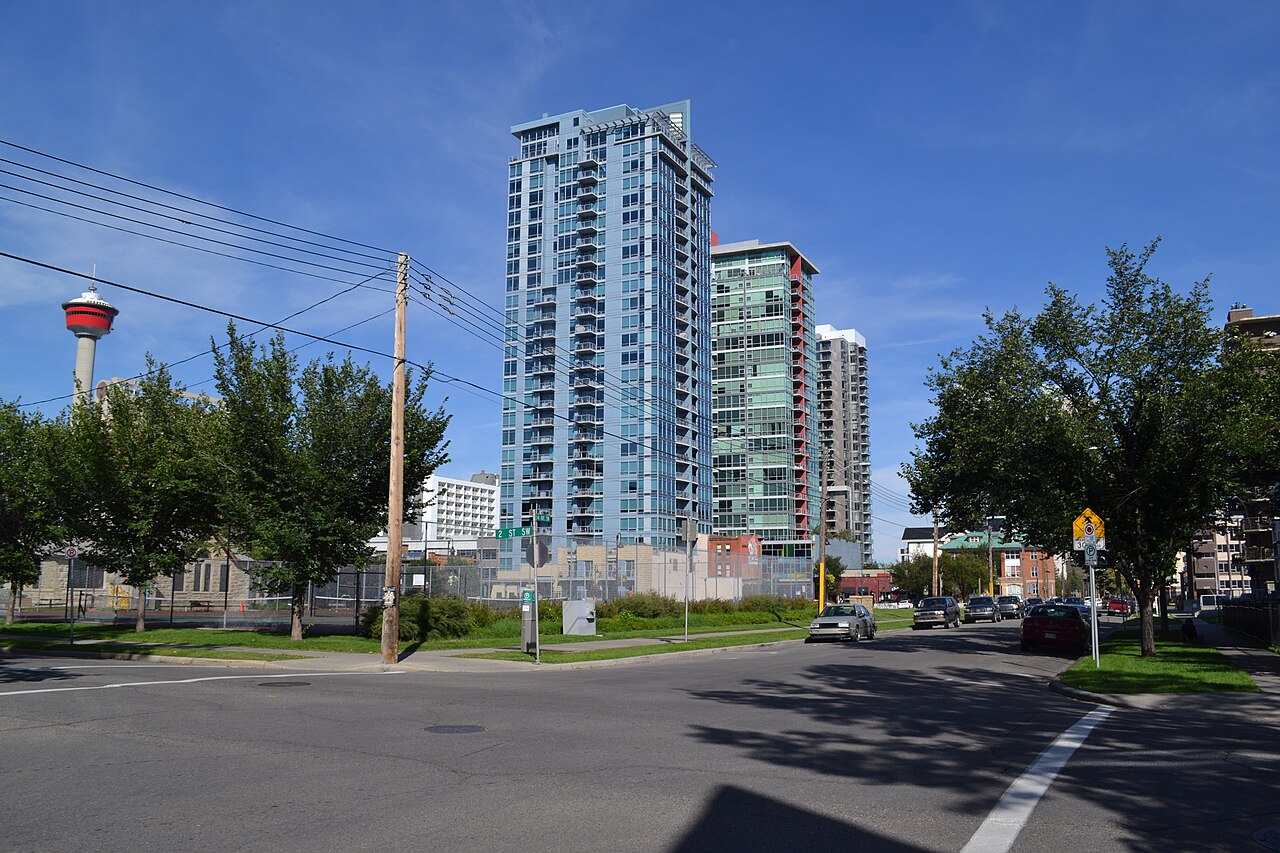
We read CMHC’s Table 1.2.1 (vacancy by year of construction) and Table 1.2.2 (average rent by year of construction) for the census metropolitan area total in each of the 18 workbooks CMHC published for 2025. Ottawa-Gatineau appears as two workbooks, an Ontario part and a Quebec part, and we kept them separate. CMHC suppresses the 2015-and-later vacancy figure in St. Catharines-Niagara and Windsor, which leaves 16 areas.
The newer-building rate was higher than the all-ages rate in Vancouver (7.9 against 3.7 per cent), Ottawa’s Ontario part (6.7 against 3.0), Edmonton (6.3 against 3.8), Gatineau (6.3 against 3.8), Calgary (6.0 against 5.0), Kitchener-Cambridge-Waterloo (5.6 against 4.1), Montréal (5.1 against 2.9), Toronto (4.9 against 3.0), Victoria (4.2 against 3.3), Québec (4.1 against 2.4), Saskatoon (3.8 against 3.3), Winnipeg (3.8 against 2.8), Halifax (3.3 against 2.7) and Regina (2.8 against 2.7, a gap of one-tenth of a point). It was lower in Hamilton (3.4 against 3.6) and London (3.7 against 4.0). CMHC rates the Halifax, Hamilton and Kitchener-Cambridge-Waterloo newer-building figures as poor quality, to be used with caution, and Edmonton, Gatineau and Ottawa as good rather than very good or excellent.
Compared with a year earlier, the newer-building vacancy rate rose in 13 of the 16 areas and fell in three: Toronto (6.8 to 4.9 per cent), Calgary (7.1 to 6.0) and Victoria (5.4 to 4.2). The all-ages rate rose in all 16 areas, so the newer buildings did not move in step with the wider market everywhere: Toronto, Calgary and Victoria improved while the rest of their stock became emptier.
The same tables give average rent for each age group. In 17 of the 18 areas, buildings completed in 2015 or later averaged between 14 per cent more than the all-ages average in Calgary ($2,003 against $1,761) and 44 per cent more in Toronto ($2,763 against $1,913); Windsor’s premium was 63 per cent, but CMHC rates that rent as poor quality. The average rent in the newer group fell between October 2024 and October 2025 in Hamilton ($2,211 to $2,040, down 7.7 per cent), Windsor ($2,172 to $2,092, down 3.7 per cent), Vancouver ($2,595 to $2,526, down 2.7 per cent) and Calgary ($2,021 to $2,003, down 0.9 per cent). It was essentially unchanged, within half a per cent, in Toronto ($2,764 to $2,763), Ottawa’s Ontario part ($2,372 to $2,375) and Winnipeg ($1,722 to $1,727). It rose in the other 11, from 2.1 per cent in Saskatoon to 7.8 per cent in London.
These are not price cuts. The newer group gains buildings each year as projects are completed and enter the survey, so its average moves with the mix of buildings and unit sizes, and CMHC’s same-sample rent measure, which we reported on in our analysis of Table 1.1.5, is the better guide to what existing tenants pay. The tables do not say why vacancy is higher in newer buildings, whether landlords are offering incentives, or how many of the vacant units are in recently completed projects still leasing up, and we did not test any of those explanations. Our analysis of turnover and our report on vacant-unit premiums cover two other pieces of the picture.
The figures describe private apartments in structures of three or more units in CMHC’s October Rental Market Survey, not condominium units rented by their owners, basement apartments, houses or social housing. Each figure is a survey estimate with its own margin, which is why CMHC grades quality and marks some changes as not significant. CMHC has said that a 2025 change in how it classifies units of unknown bedroom count affects year-over-year comparisons by bedroom type, so we used only the all-bedroom totals. CMHC plans to release its 2026 survey data on Dec. 8, 2026. No landlord, city or agency is accused of anything in this analysis.
How we checked: We downloaded the 18 CMHC 2025 Rental Market Report data workbooks for the major centres from CMHC’s rental market reports page on Nov. 17, 2026, extracted the CMA total block of Table 1.2.1 and Table 1.2.2 (all bedroom types, October 2024 and October 2025) with their quality ratings, and compared the “2015+” row with the “Total” row for each area. The counts, the percentage changes and the premiums are our calculations from those figures.
Follow Canada News Media
Get the day's top Canadian stories and our two daily 60-second news videos wherever you scroll.
X Threads Facebook Instagram LinkedIn TikTok YouTube Pinterest Reddit Substack Flipboard Newsletter RSS